
Write something

🔥
7d •
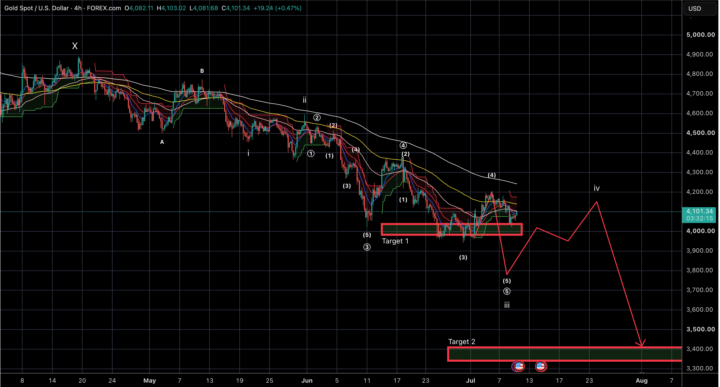
Gold - Clearer Path
Date: 09/07 From our last post we had highlighted a bullish as well as bearish scenario for Gold. At the moment prices have reversed and price action is leaning in more towards our bearish scenario. So according to this scenario - where do we stand? Gold price seems to be moving down to complete its 3rd wave of wave C. This 3rd wave is to come down as an impulse - here we are currently in wave 5 with the current pullback being marked as the 4th save of this impulse. Once this 3rd wave completes we can expect another pullback - one that is possibly longer drawn in both terms of price as well as time before a final 5th wave on the larger scale coming down towards 3600 - 3400 levels depending on where our 4th wave ends. Golds strongest and biggest rally is meant to follow this correction. They won't make it easy to catch the reversal. We need to be sharp and ready with all different scenarios 🚀💪 Attaching 4H and 1H charts for clarity below
🔥
15d •
Gold - Is W4 Over?
Date - 01/07 The long standing question on everyone's mind - Is wave 4 finally over? Has the WXY corrective ended? Depending on how you see the charts - you can get both answers! As Elliott wave analysts it is important that we understand and explore BOTH the bearish and bullish outlooks on the charts before we can make a well informed decision. Let's first start with the bullish scenario. What does it have going for it? 1. Correction has been going for a long time 2. WXY corrective pattern could be termed complete. Its met the minimum requirement to complete this pattern 3. RSI divergences building up 4. Lower Bollinger bands holding support In the bullish scenario - we can see that the WXY pattern could have completely played out. We have the W wave forming with the low of 4098 on 23rd of march. The X wave then formed its high of 4885 on 17th April. Lastly, we had an ABC coming down in the form of Wave Y forming a low near our first initial target of 3968 (low of 3942). This was one of the points where we were expecting (and still are) a bounce at the very least if not an up move/reversal. Charts for bullish view below Now let's have a look at the bearish outlook. What can we focus on here? 1. Firstly, silver is yet to complete its correction too. The WXYXZ pattern is not yet complete with silvers current up move clearly corrective. It is very rare that both these commodities are running inversely. If Gold has to begin its next rally, silver must also complete or be close to completing its correction. 2. RSI - divergent .. yes .. but not yet oversold. When Gold completed wave W the RSI was playing at around 26 (below 30 being oversold). The RSI on the daily chart currently sits comfortably at around 35. 3. Weekly 100 EMA support - This level lands at around 3700 levels 4. No candle price action reversal .. yet. On any time frame. The candle structure on all time frames 4H / D / W /M are still bearish. If this is a reversal it is still very early. Remember we need to factor in and trade price action!

22d •
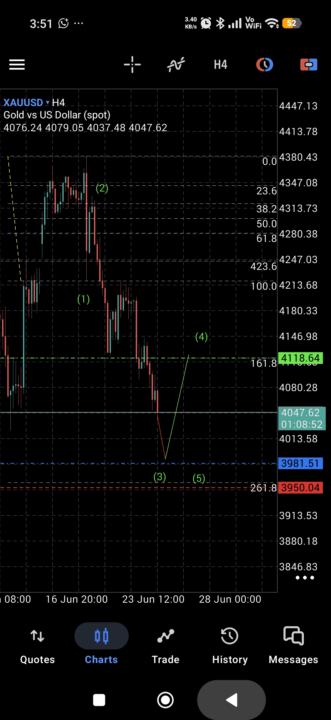
Gold-usd
Gold 4th impulse trade setup Entry - 3981 Stoploss - 3950 Profit - 4118 Rewards - 1:4 Anything suggestion comment below 👇
🔥
23d •
Gold - Sticking To The Path
Date: 24/06 Once the Gold broke its previous swing low last week the structure became very apparent and it has been sticking to the WXY pattern very well so far. Now where exactly are we in this pattern and what can the next few trading sessions look like? Wave W as mentioned earlier has completed when gold formed its low of 4098. We then had wave X topping out with a high of 4890. We are now currently in the process of wave Y completing which will most likely be the end of this long correction that began on the 29th of January. Breaking down wave Y, we need to see the completion of an ABC coming down from the top of wave X. As the chart indicates, wave A and B seem to be complete and wave C is now making its way down in an impulse. Of wave C, wave 1 and 2 are complete and wave 3 is currently still playing out. I expect wave 3 to complete either near or past our first target area of 3968 and a sideways wave 4 to begin playing out. Wave 4 could see gold prices pulling back to 4200 - 300 levels and should also ideally respect the downward channel drawn on the chart. Once completed, Wave 5 should begin and depending on how strongly it plays out it could bring prices to around 3400 - 3300 levels. This 3400 - 3300 area would be a huge alert zone for us. This is where we would be looking for any positive price action or breaking of particular swing highs to mark the end of this huge correction and the beginning of the next strong impulse pushing gold prices back past and to new all time highs. Charts below.
🔥
25d •
Silver Path Ahead
Date: 21/06 Since making its all time highs on 29th Jan (121) silver has entered into a complex WXYXZ correction. This structure is actually even more complex than the WXY we studied on the Gold chart. This correction indicates a triple correction taking place. Even though this structure doesn't surface often, it does arise when a particular asset has an extremely strong and fast previous impulse. Very similar to what silver has demonstrated to reach its all time high. Towards the end of October 25 - Silver was trading at around $45 -- By Jan 26 it was at 120. The price tripled in 3 months. This kind of an up move is almost always followed by a long complex correction which slowly drags us more than 50% back down from the high recently created. I've marked the various ABC correctives forming the larger WXYXZ corrective in the image below. WE are in the advance stages of the correction with only the final leg of wave Z remaining. Even though we may still have a bit of the correction to follow - silver is an asset we must keep an eye on as the next impulse promises to be strong and take us back past the all time high set around 120 Image below
1-30 of 52

skool.com/investoredgeclub
Clarity. Confidence. Wealth. Proven trading & investing foundations with Elliott Wave insights
Leaderboard (30-day)
1
+87
2

+73
3
+66
4

+14
5

+11
Powered by