Activity
Mon
Wed
Fri
Sun
Aug
Sep
Oct
Nov
Dec
Jan
Feb
Mar
Apr
May
Jun
Jul
What is this?
Less
More
Owned by Abhishek
Clarity. Confidence. Wealth. Proven trading & investing foundations with Elliott Wave insights
Memberships
Skoolers
166.9k members • Free
Aussies on Skool 🦘
62 members • Free
🇦🇺 Sydney IRL
291 members • Free
Synthesizer: Free Skool Growth
44.5k members • Free
THE SKOOL HUB
5.4k members • Free
Impulse Wave Trading
4 members • Free
The AI Hub
226 members • $5/month
the skool CLASSIFIEDS
2k members • Free
SD
Separated Dads Mindset Group
9 members • Free
147 contributions to Investor Edge Club

🔥
3d •
Weekly Market Outlook (6th July)
Recap of last week: - US Oil still drifting towards our next target of 65 as discussed. Current low sitting at 67 but still no confirmation that wave 4 has begun - US30/US100 saw some early pressure but the dips were bought more so in the US30 which gave a pretty strong weekly close. US100 still base building but ready to launch - Gold and Silver remained strong last week and have given a good rise from their swing lows Factors for this week: - Oil should soon find its bottom (of wave 3) and begin wave 4. We were expecting this last week but no signs yet to confirm that wave 4 has begun. - US30 - Going strong and will continue to rise. May have a bumpy day mid week but continue to buy on dips until 54000+ levels are here - US100 - Base building should be done. US100 seems set to rally this week as well - US dollar is almost ready to complete its corrective pullback and begin the next step of its rally - Gold and Silver are at an important juncture. This week will be very important in determining which scenario they fall into. A strong week breaking important levels could prove that the W4 corrective is over. However, if bearishness comes back in midweek and gold / silver close the week with a bearish candle, chances are we are going to see new lows in both the commodities.
🔥
0 likes • 2d
@Ryan Williamson Totally agree
🔥
1 like • 2d
@Jason King So have a tight trailing stop loss now. Wave 3 should end anywhere between 65 - 60 levels. For wave 4 I'm expecting a pretty strong price wise correction. Wave 2 only did 38% retracement. According to rule of alternation, wave 4 will be pretty strong. Best book at a comfortable level (we're already 6R +) and when a new trade surfaces post W4 we can look to re-enter again.
🔥
3d •
🌊 Elliott Wave Traders... I've Got a Question.
Which corrective pattern do you find the hardest to identify in real time? A) Zigzag (5-3-5) B) Flat (3-3-5) C) Triangle (3-3-3-3-3) D) W-X-Y Combination E) W-X-Y-X-Z Triple Combination 💬 Which one gives you the most trouble, and why? I'd love to hear everyone's experiences. Once a few people have replied, I'll share some of the things I look for when trying to distinguish between the different corrective structures.

🔥
4 likes • 3d
You can also tell me which one is your favourite! The one you find easiest to identify 😄
🔥
2 likes • 2d
Seems like the combination correctives are clearly a challenge for everyone. They are surely some of the hardest to pin down correctly
🔥
30d •
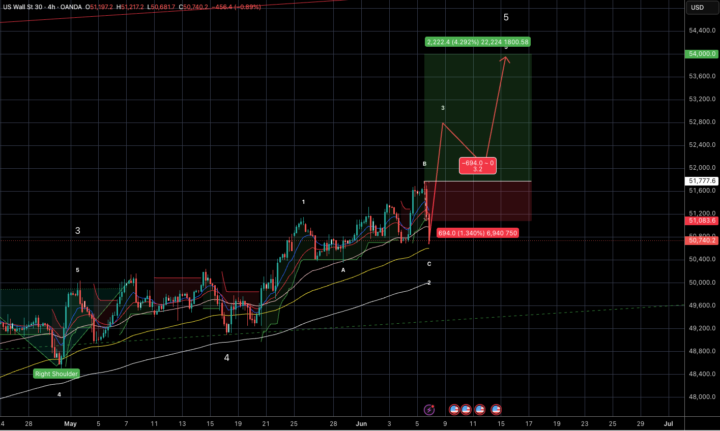
US30 Trade
Buy - Above 51777 SL - 50681 (or currently forming swing low) Tgt - 54000 ++ RR - 3.2+
🔥
1 like • 18d
@Jason King Yep
🔥
1 like • 4d
This is still on by the way. Currently closing in on 2R
🔥
5d •
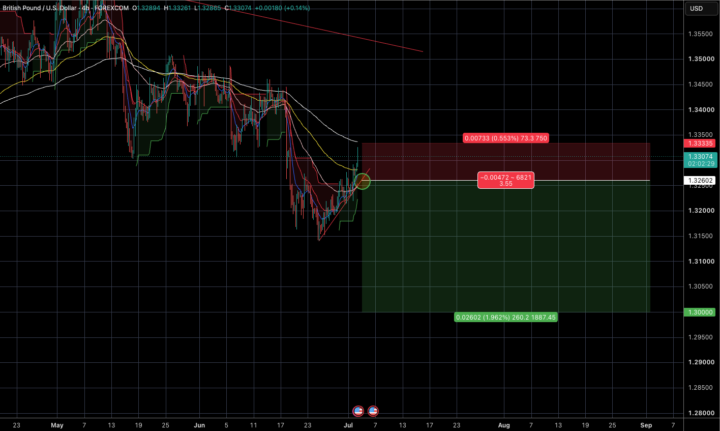
GBPUSD Trade
Sell below - 1.2600 (sustained break of trend line) SL - 1.33261 (Swing High created once trade active) Tgt - 1.3000 RR - +3.5
🔥
0 likes • 5d
@Ryan Williamson Yes. 4H
🔥
0 likes • 4d
We've got to keep moving this trade up as the price moves up. Only active once the trend line breaks on the downside

15d •
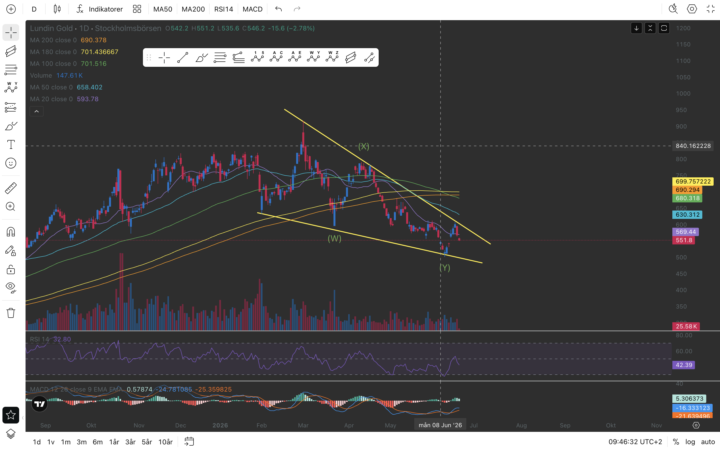
Thoughts on chart?
Hi! Totally new here and pretty new to the Elliott Wave. Not sure if question posts like these are what you do here but thought I'd give it a whirl. What do you think about this chart? Does it make any sense and are there any obvious improvments? Any inputs are appreciated.
🔥
0 likes • 7d
@Jason King same here 😅
🔥
2 likes • 4d
@Gottfrid Silverek No worries at all! Oh I see .. makes sense. I don't think my subscription gives me access to that data
1-10 of 147

🔥
@abhishek-kapadia-5169
Elliott Wave analyst helping investors & traders read market structure, manage risk, and make better decisions across stocks, ETFs, FX & crypto.
Active 13h ago
Joined Aug 20, 2025
Powered by