
🔥
22d (edited) • Charts + Analysis 📈📊
Gold - Sticking To The Path
Date: 24/06
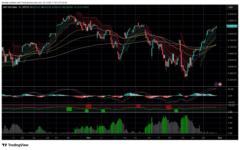
Once the Gold broke its previous swing low last week the structure became very apparent and it has been sticking to the WXY pattern very well so far. Now where exactly are we in this pattern and what can the next few trading sessions look like?
Wave W as mentioned earlier has completed when gold formed its low of 4098. We then had wave X topping out with a high of 4890. We are now currently in the process of wave Y completing which will most likely be the end of this long correction that began on the 29th of January.
Breaking down wave Y, we need to see the completion of an ABC coming down from the top of wave X. As the chart indicates, wave A and B seem to be complete and wave C is now making its way down in an impulse.
Of wave C, wave 1 and 2 are complete and wave 3 is currently still playing out. I expect wave 3 to complete either near or past our first target area of 3968 and a sideways wave 4 to begin playing out. Wave 4 could see gold prices pulling back to 4200 - 300 levels and should also ideally respect the downward channel drawn on the chart. Once completed, Wave 5 should begin and depending on how strongly it plays out it could bring prices to around 3400 - 3300 levels.
This 3400 - 3300 area would be a huge alert zone for us. This is where we would be looking for any positive price action or breaking of particular swing highs to mark the end of this huge correction and the beginning of the next strong impulse pushing gold prices back past and to new all time highs.
Charts below.
5
9 comments
Gold - Sticking To The Path

skool.com/investoredgeclub
Clarity. Confidence. Wealth. Proven trading & investing foundations with Elliott Wave insights
Leaderboard (30-day)
1
+87
2

+73
3

+66
4

+14
5

+11
Powered by