Activity
Mon
Wed
Fri
Sun
Aug
Sep
Oct
Nov
Dec
Jan
Feb
Mar
Apr
May
Jun
Jul
What is this?
Less
More
Memberships
Investor Edge Club
62 members • Free
2 contributions to Investor Edge Club

🔥
5d •
Gold - Is W4 Over?
Date - 01/07 The long standing question on everyone's mind - Is wave 4 finally over? Has the WXY corrective ended? Depending on how you see the charts - you can get both answers! As Elliott wave analysts it is important that we understand and explore BOTH the bearish and bullish outlooks on the charts before we can make a well informed decision. Let's first start with the bullish scenario. What does it have going for it? 1. Correction has been going for a long time 2. WXY corrective pattern could be termed complete. Its met the minimum requirement to complete this pattern 3. RSI divergences building up 4. Lower Bollinger bands holding support In the bullish scenario - we can see that the WXY pattern could have completely played out. We have the W wave forming with the low of 4098 on 23rd of march. The X wave then formed its high of 4885 on 17th April. Lastly, we had an ABC coming down in the form of Wave Y forming a low near our first initial target of 3968 (low of 3942). This was one of the points where we were expecting (and still are) a bounce at the very least if not an up move/reversal. Charts for bullish view below Now let's have a look at the bearish outlook. What can we focus on here? 1. Firstly, silver is yet to complete its correction too. The WXYXZ pattern is not yet complete with silvers current up move clearly corrective. It is very rare that both these commodities are running inversely. If Gold has to begin its next rally, silver must also complete or be close to completing its correction. 2. RSI - divergent .. yes .. but not yet oversold. When Gold completed wave W the RSI was playing at around 26 (below 30 being oversold). The RSI on the daily chart currently sits comfortably at around 35. 3. Weekly 100 EMA support - This level lands at around 3700 levels 4. No candle price action reversal .. yet. On any time frame. The candle structure on all time frames 4H / D / W /M are still bearish. If this is a reversal it is still very early. Remember we need to factor in and trade price action!

1 like • 4d
@Jason King Agreed! I can't see the correction as over either.
14d •
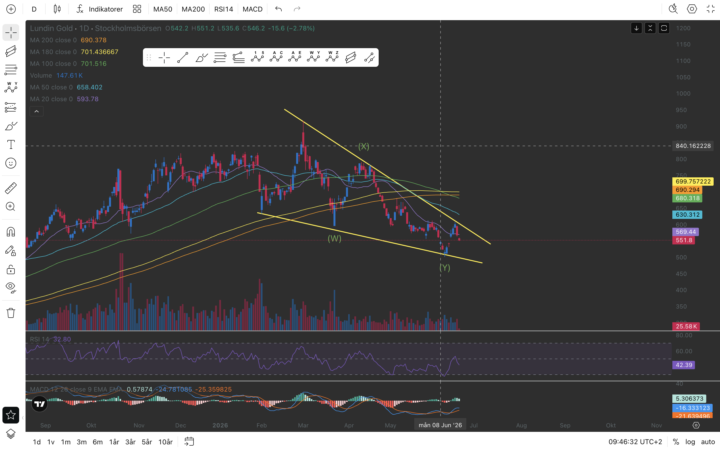
Thoughts on chart?
Hi! Totally new here and pretty new to the Elliott Wave. Not sure if question posts like these are what you do here but thought I'd give it a whirl. What do you think about this chart? Does it make any sense and are there any obvious improvments? Any inputs are appreciated.
3 likes • 11d
@Abhishek Kapadia yeah we haf further downside the last few days but up today, which I think is the start of a 2 wave in a 12345 coming down from B to C. The lower trendline still needs to break though. We are probably looking at a prize target of about 400 ish according to the fib.
2 likes • 4d
@Jason King @Abhishek Kapadia sorry for not having been very active and responding, been working a lot. It's a Swedish gold mining company. Don't know why you can't find it but it's trading on the Swedish OMX.
1-2 of 2

Active 18h ago
Joined Jun 21, 2026
Powered by