Activity
Mon
Wed
Fri
Sun
Jul
Aug
Sep
Oct
Nov
Dec
Jan
Feb
Mar
Apr
May
Jun
What is this?
Less
More
Memberships
Investor Edge Club
48 members • Free
108 contributions to Investor Edge Club

🔥
13h •
🎯 Let's Talk Risk Management
Everyone talks about entries. Very few traders talk about what happens after they enter a trade. I'm curious how everyone approaches risk management because there are so many different styles. 👇 Share your approach: 📌 How much do you risk per trade?(0.5%, 1%, 2%, more?) 📌 When do you move your stop to breakeven? - At 1:1? - At 1:2? - Never? 📌 How do you manage profits? - Fixed target? - Trailing stop? - Scale out along the way? 📌 Do you increase position size after a winning streak?Or reduce it after a losing streak? I've found that two traders can use the exact same strategy and get completely different results because of how they manage risk. Would love to hear how everyone approaches it 👇 And if you've changed your approach over the years, tell us what changed and why.
1 like • 7h
Risk Management is key! 1% risk every trade - no more / no less - don't usually change that regardless of winning or losing streak Move to breakeven after is 1:1 or 1:2 depending on the trade. I always divide the 1% risk into smaller lots and keep booking partials at different targets.
🔥
13d •
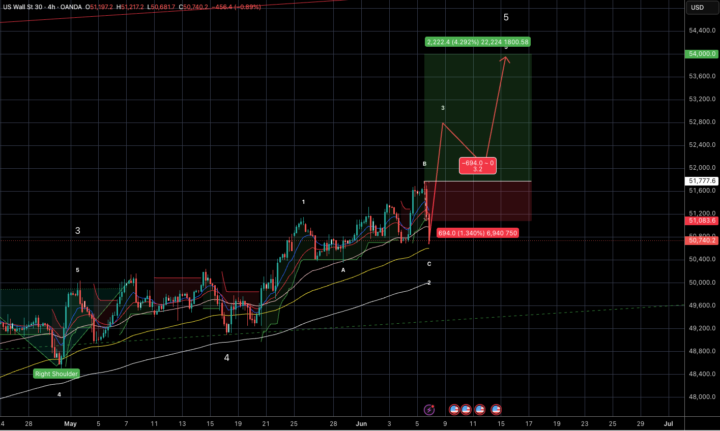
US30 Trade
Buy - Above 51777 SL - 50681 (or currently forming swing low) Tgt - 54000 ++ RR - 3.2+
2 likes • 13d
Ah makes sense - I was thrown off by fridays fall
1 like • 2d
@Abhishek Kapadia Buy the dip?
🔥
29d •
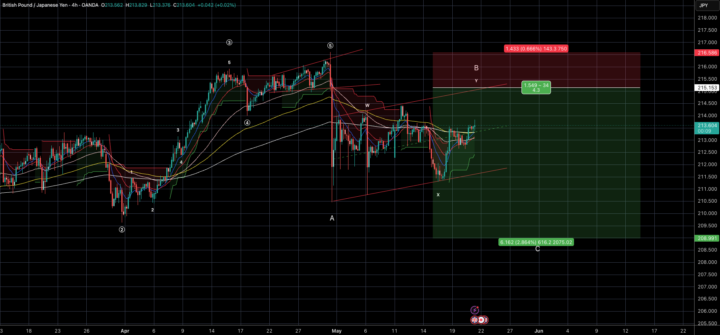
GBPJPY Trade
Sell Area - 215 -215.200 SL - 216.602 Tgt Area - 209 RR - 1: 4 A trade you can plug into your system 😃
1 like • 13d
@Abhishek Kapadia YESSSS! I got in 215.130. Riding the profit now
1 like • 2d
Still holding this - seems to be in a range
🔥
4d •
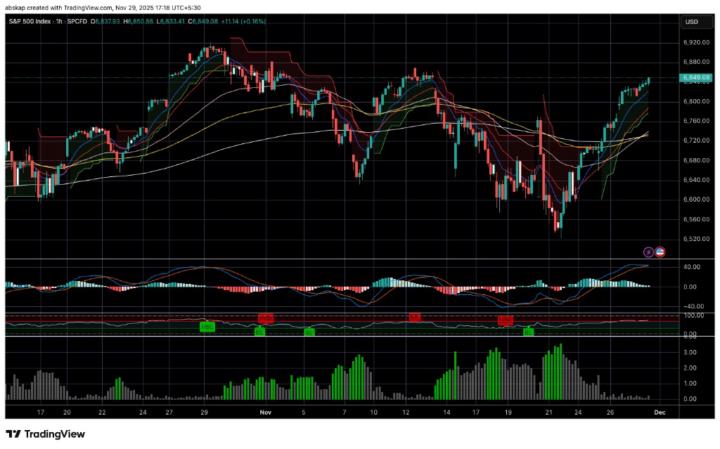
What Correction Is This?
The image below is that of the Gold chart from a few months ago! Can you identify and/or mark out this corrective? What type of correction is this? Let's put our Elliott wave knowledge to the test!

2 likes • 2d
@Suresh Appayi Solid
2 likes • 9d
Such a relaxed trade - still just holding - new low 85.95
1 like • 4d
@Abhishek Kapadia 🚀
1-10 of 108