
Write something
Pinned

10d •
Elliott Wave - Complete Course Is Now Live!
Hey everyone! The complete Elliot wave course is now live and freely available to all our members in the classroom tab! The modules are as follows: 1. Introduction to chart reading 2. TradingView and Indicators 3. Elliott waves 101 4. Basic corrective patterns 5. Elliott waves 102 & beyond [NEW - Wave extensions, targets, fibonacci etc] 6. Advanced corrective patterns [NEW - WXY, WXYXZ, extended and running flats] Would love any feedback from people that go through the course and of course please use our Elliott Wave tab in the community to post up any thoughts, observations or questions! 🚀😄

Pinned
Aug '25 •
👋 Welcome to Investor Edge Club – Start Here!
Hi everyone — I’m so glad you’re here! Investor Edge Club was built with one mission: to cut through the noise and give investors and traders a place to build wealth with clarity, confidence, and consistency. Here’s what you’ll find inside this community: - 📘 Free resources like the Insider Edge Toolkit to kickstart your journey. - 📊 Weekly insights on markets, sectors, and opportunities. - 📈 Elliott Wave and swing setups (explained in plain English). - 💬 A supportive place to ask questions, learn together and share charts, ideas and wins. - 📌 Monthly stock picks with huge long-term upside potential. - 📉 Methods and techniques to read charts and spot strong companies. - 💵 Money management strategies — from simple consistent investing to advanced plug-and-play approaches. 👉 Your first step: 1. Download the Toolkit (pinned above). 2. Introduce yourself below — share where you’re from and your #1 investing or trading goal for the year. 3. Explore the classroom content and join the conversation! Welcome aboard — let’s build smarter portfolios and sharper trades, together 🚀 Abhishek
12d •
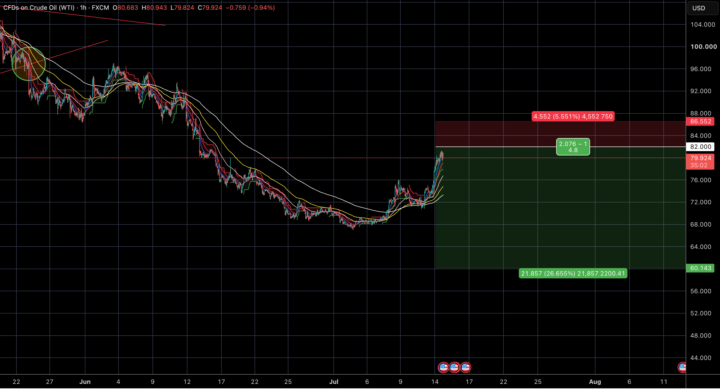
US Oil Trade
Sell Area - 82 SL 86.500 (Overlap with W1) TGT - 60 (and below) RR - 4.8+ Continuation of our previous trade
3h •
Gold - Price Action
Date: 26/06/26 Gold price action has been playing out both ways and is showing us a clearer path with every passing day. I can narrow it down to two basic scenarios that address the question is the WXY corrective over? Once again we may have two scenarios with one being more likely than the other. Lets jump right into it Scenario 1 - Bullish This is the bullish scenario. The WXY corrective is over with the low of 3941 and we have an apparent new impulse from that point. With a strong up move from that point the internet went crazy with impulse counts and videos suggesting price action running to the moon. According to the first scenario we have an impulse forming the first wave followed by an extremely deep wave 2 making a low of 3959. We are now preparing for wave 3 to start with prices about to begin the next phase of the upward movement. Here's my problem with this scenario - First off according to me the corrective WXY count hasn't played out fully. Secondly even though the first "impulse is done" it hasn't broken past the declining trendline which would strongly indicate that this down move may be over. Lastly, the depth and way with price action has played out with W2 being so deep and the follow up price action of "wave 3" being so sideways. Something doesn't add up? I would say we can't rule this scenario out but we're looking at it and keeping a bit of distance from it. Likely hood of this scenario to play out would b 15- 20% maximum. I would not consider this scenario valid until we start sustaining over 4200. Scenario 2 - Bearish The bearish scenario is what I've been leaning towards for a while now. The overall corrective just doesn't seem complete! There's room on the downside and the pattern does not seem like it's done. Of course we must remember that we trade PRICE .. not structure! No matter what I feel the structure is - if price action breaks upwards I will be forced to re look at my count and structure. However, at the moment price action seems to be supporting this scenario more and more. According to this scenario we are currently still in Wave Y with A and B having played out and the C wave currently in Wave 4!

3h •
Weekly Market Outlook (27th June)
Recap of last week: - US Oil prices soared changing the chart structure. We were expecting wave 4 followed by a 5th wave to play out. This up move from the previous week suggests US OIL has burst into a wave B (first choice scenario) or a new impulse - Gold / Silver has shown indecision with the weekly candle. This usually implies a sideways corrective that is currently ongoing - US30/100 are both showing weekness but still protecting all support levels that would trigger a bearish setup. Keeping the structure buy on dip Factors for this week: - US Oil price action will determine what kind of structure we're forming. A very important week for US Oil traders! Few very good opportunities can come up with we can confirm that this is a wave B - Gold and Silver should begin their bearish cycle down to new lows. There are key levels on the upside that both commodities have failed to break. - US30 / US 100 shows a make or break week! It's time this week to test the support levels and determine the final structure. Buy on dip to be maintained will these levels are broken with safer buyers to wait for daily price action reversal before going long.
1-30 of 165

skool.com/investoredgeclub
Clarity. Confidence. Wealth. Proven trading & investing foundations with Elliott Wave insights
Leaderboard (30-day)
1

+61
2
+56
3

+56
4

+3
Powered by