Activity
Mon
Wed
Fri
Sun
May
Jun
Jul
Aug
Sep
Oct
Nov
Dec
Jan
Feb
Mar
Apr
What is this?
Less
More
Memberships
Unchained CEO
444 members • Free
North Eden Community
285 members • Free
Little G Farms
44 members • Free
Off Duty Truckers
24 members • Free
The Off Grid Collective
414 members • Free
Off Grid Only Collective
80 members • Free
Herman Homestead
57 members • Free
Off Grid Academy
50 members • Free
ConstructionX AI Hub
165 members • Free
63 contributions to The Energy Data Scientist

6d •
Download The Global Energy Talent Index Report 2025
Just sharing the Global Energy Talent Index (GETI) Report 2025. This report is about five-year workforce trends across the traditional, transitional, and future energy sectors. It is drawing on insights from nearly 11000 global professionals to map out the industry's evolving landscape. The findings show the rise of local clean energy projects. Shows also an intensifying competition for talent, with employees increasingly valuing clear career pathways, technological innovation, and the opportunity to make a meaningful impact on the energy transition.

6d •
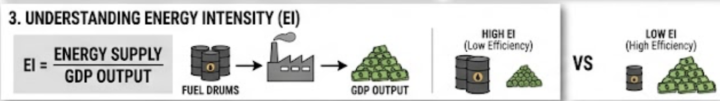
🚨 NEW EXECUTIVE BRIEF: Energy Intensity & The Impact of Oil Shocks
Here is the macroeconomic breakdown from our latest intelligence report: Oil price shocks (such as disruptions at the Strait of Hormuz) hurt developing economies far more than richer ones. Why does this happen? Because developing countries use more energy per unit of economic output and depend heavily on imported fuel and industrial inputs. Richer economies have steadily improved their energy efficiency since 1990 by shifting toward services, while developing economies remain stuck in energy-intensive manufacturing. Furthermore, because oil and gas are key inputs for fertilizers, chemicals, and plastics, a fuel shock rapidly ripples into food security and industrial production, widening the economic gap between rich and poor nations. 🔑 KEY CONCEPT: Energy Intensity (EI) The attached screenshot illustrates Energy Intensity—the ratio of energy supply to GDP output. Essentially, it measures how much energy an economy consumes to produce a unit of economic value. 🔻 High EI (Low Efficiency): Lots of fuel is needed to generate GDP (represented by a large barrel with a small money pile). 🟢 Low EI (High Efficiency): A small amount of energy produces a large pile of economic output (represented by a small barrel with a large money pile). 📊 DOWNLOAD THE REPORT: Head over to the "Energy Market Intelligence" section inside the Classroom tab to download the full PDF. The report includes all downloadable market diagrams and official citation links (Financial Times, WSJ, Bloomberg).
1 like • 6d
Great insights. Thanks for the graphs
24d •
New Report: Oil Price, Bonds & USD
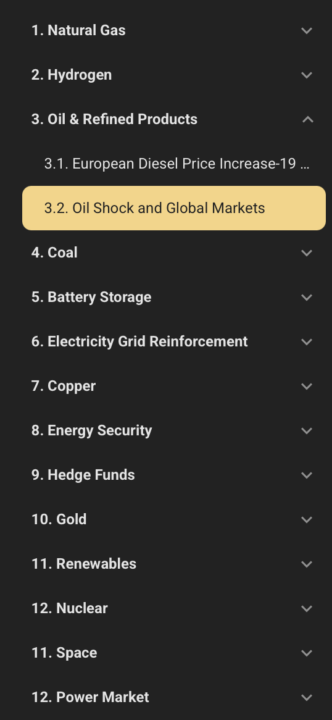
Rising oil prices from Middle East conflict spread quickly through the global economy. They have: a) increase dinflation, b) pushed up short term bond yields, c) strengthened the US dollar, d) raised costs for oil importing countries. A new report on this topic has now been published in Classroom, at the very end under “Energy Industry Support”, a special section featuring reports that explain the current status and key trends in the energy sector. The report is written in simple language, includes illustrative graphs, and shares official sources from the Financial Times, Bloomberg, Wall Street Journal, The Economist, Forbes, and Investors Chronicle. It can be freely used in your projects, work, or studies. It may be especially useful for interviews, presentations, networking, and broader professional development. It is strongly recommended to read it and download it for your use. See the attached screenshots.
0 likes • 24d
Yes, the dollar point is very important. A stronger dollar can spread the pain far beyond the Middle East. It raises the local cost of fuel. It can also make life harder for weaker economies.
Mar 5 •
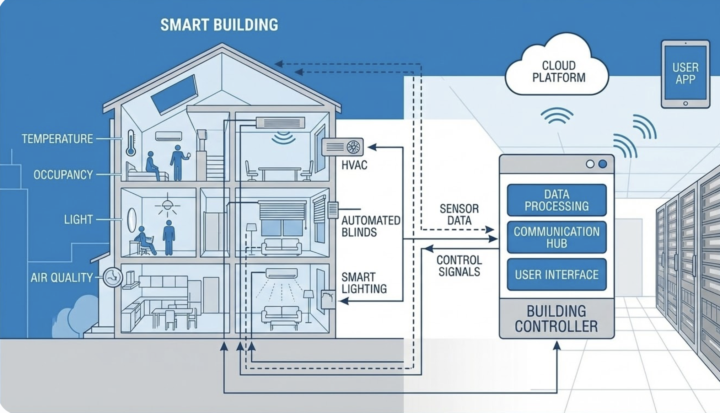
New Online Course: Reinforcement Learning for Energy
In this course, we are developing a model in Python that uses Reinforcement Learning to minimize the operating costs of a Smart Building (also known as an 'energy hub'). The course is In the 'Classroom' at the very end (numbered 117). The full Python code is available for download. Definitely watch the videos as they explain all details necessary. Below is an explanation (using simple language with all jargon explained). Also you can download a slide in PDF (the slides in PowerPoint format are inside the course). I believe the best way to truly understand Machine Learning and Reinforcement Learning is by diving straight into the code. The code in these videos is based on a real-world application where I tested various methodologies to determine the most cost-effective way to operate a smart building. This building is 'smart' because of how it manages energy. It is equipped with its own energy storage unit (a battery), a solar photovoltaic (PV) unit, and a central computer system. Using advanced algorithms, this system autonomously decides: - When and how much to charge or discharge the battery. - Whether to curtail (reject) excess energy output from the solar PV unit. - When and how much electricity to purchase from the main grid. Over time, we have explored different algorithms for this central computer system. We covered Monte Carlo methods in Course 115 and Stochastic Optimization in Course 116. This new course (Course 117) focuses specifically on Reinforcement Learning. Reinforcement Learning is a subfield of Machine Learning. While traditional Machine Learning models learn by studying historical datasets, Reinforcement Learning trains an algorithm to learn through trial and error—interacting with an environment to figure out the best sequence of actions to achieve a goal. Machine Learning is a subfield of AI, and Reinforcement Learning is a specific branch of Machine Learning. Machine Learning models learn by studying datasets. It's called Reinforcement Learning similar to behavioral psycholog which says that we are learning through rewards and penalties. When the AI (the "agent") takes an action that gets it closer to its goal (in our case: saving money in the smart building) it receives a mathematical "reward." This positive feedback reinforces that specific behavior of the algorithm. Reinforcement Learning trains an algorithm (which is known as Agent) to learn through trial and error.
1 like • Mar 6
I see lots of RL models, papers etc. It is maybe the hottest topic in AI / ML for energy/economics etc. Lots of job opportunities in this space.
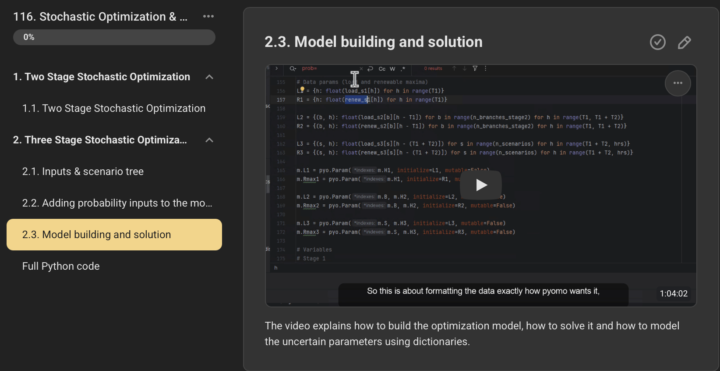
Mar 2 •
3 stage stochastic optimization: New video
The attached slide shows a high-level summary of 2-stage and 3-stage stochastic optimization. A new 65-minute video has been uploaded in the online course 116 (in the classroom) and the full Python code for a 3-stage stochastic optimization model, exactly as it is used in practice, has been uploaded. In stochastic optimization, a stage is a point in time where you are forced to make a choice based only on the information you currently have. The future is uncertain. On the left side of the slide, you see the most common framework used in operations research. It assumes uncertainty is revealed all at once in a single massive dump of information in the 2nd stage. - Stage 1 (The "Here-and-Now"): The blue box in the attached slide. You must make a blind commitment before the uncertainty happens. (e.g., Bidding into a day-ahead electricity market at midnight). - Uncertainty Resolution: The sun comes up, and the exact weather and electricity demand are fully revealed. - Stage 2 (The "Recourse"): Now that you know exactly what happened, you take "wait-and-see" corrective actions to fix any imbalances. (e.g., Firing up a fast gas generator or discharging a battery to cover a solar shortfall). - The scenario tree: One root, splitting directly into final scenarios. On the right side, you see a more realistic model where information unfolds gradually over time, rather than all at once: - Stage 1 (Initial Decision): The blue box. The first six hours of the day. - First Resolution of uncertainty: You get a partial update. You now know the general weather for the day, but not the exact minute-by-minute fluctuations. - Stage 2 (Intermediate Decisions): The orange boxes. You make mid-course corrections based on this partial knowledge (our 10 branches from Hours 6-15). - Second Resolution: The evening arrives, and all remaining uncertainty is cleared up. - Stage 3 (Final Recourse): You make your final, fine-tuned adjustments - The Tree: This creates a deep scenario tree with multiple branching points.
1 like • Mar 2
Watched it. Very helpful about how to build a 3-stage model.
1-10 of 63

@lukas-ml-1908
Pursuing greater understanding of Energy and Software Engineering for my under/post grad studies and beyond.
Active 6d ago
Joined Sep 14, 2025
Switzerland