The Energy Data Scientist
Private
1k members
$35/month

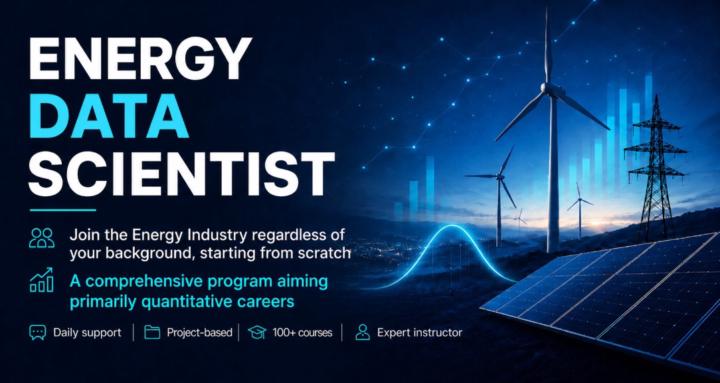
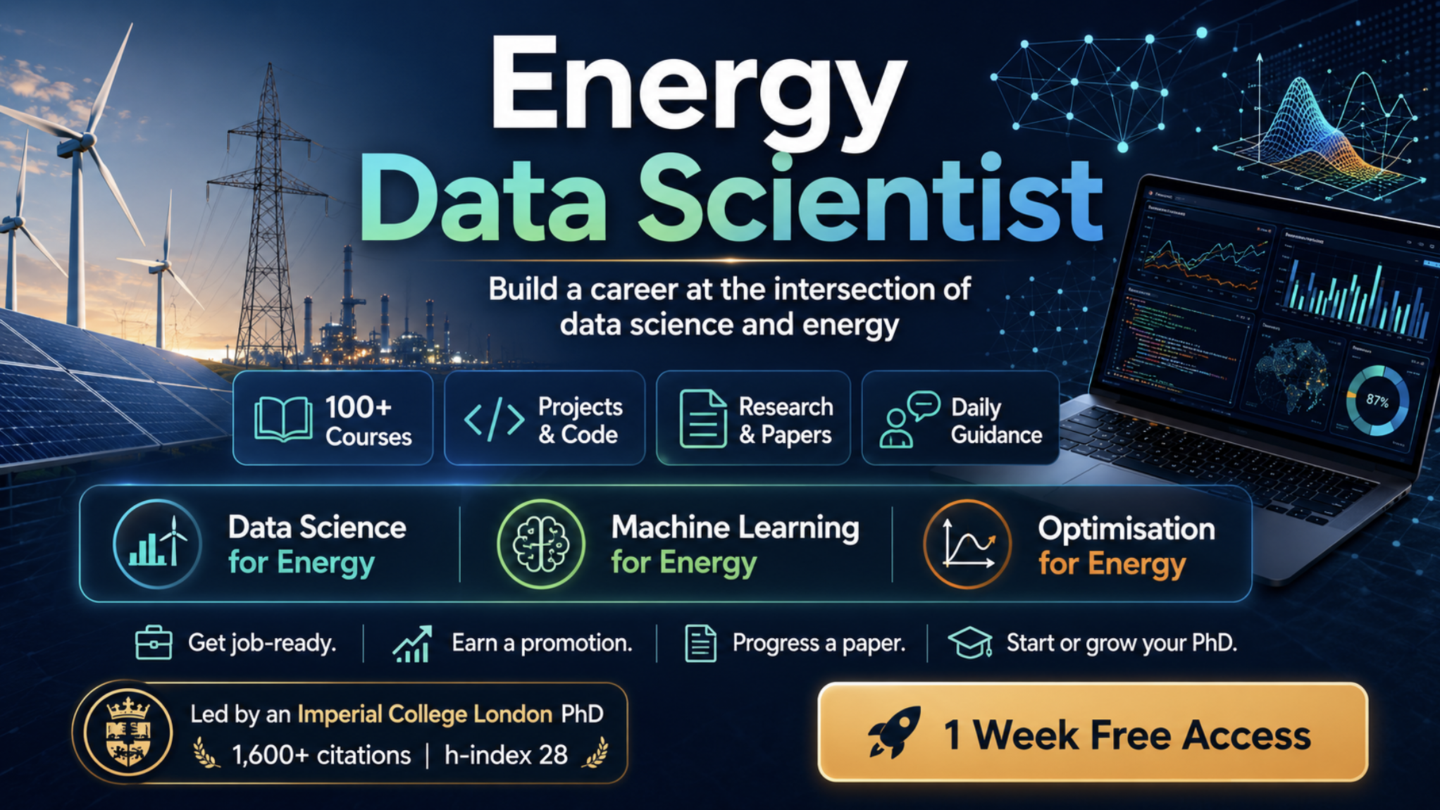
Ready to build a career at the intersection of data science and energy?
Whether you want to land your first energy role, earn a promotion, progress a paper, start a PhD or move your PhD forward, this community gives you the skills, projects and guidance to take the next step with confidence.
Learn from an energy researcher with a PhD from Imperial College London, 1,600+ citations, an h-index of 28 and significant energy project experience.
WHAT'S INSIDE
✅ 100+ online courses on energy economics, finance and investment
✅ Data science, machine learning and optimisation for energy
✅ A personalised curriculum aligned with your career goals
✅ Hundreds of downloadable code files and datasets
✅ Hundreds of research summaries, books, reports and papers
✅ Daily support and guidance as you develop energy projects
✅ Help sharing your projects with other professionals
⚡ 1 week free access. Join and start turning energy knowledge into career progress.
powered by