Activity
Mon
Wed
Fri
Sun
Mar
Apr
May
Jun
Jul
Aug
Sep
Oct
Nov
Dec
Jan
Feb
What is this?
Less
More
Memberships
Python Developers
1k members • Free
Prometheus Code
93 members • Free
Zero To App
1.2k members • $5/month
Engineers
110 members • Free
Energy Economics & Finance
387 members • Free
24 contributions to Energy Economics & Finance

3d •
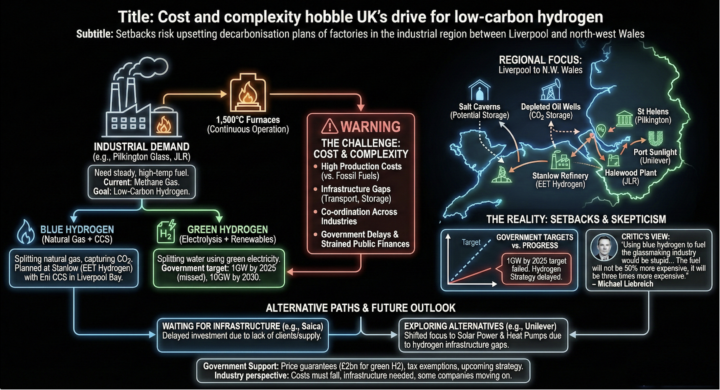
An illustration about Hydrogen
Here is a plot about hydrogen in the United Kingdom. The plot shows that energy factories need steady, very high temperature heat, around 1500°C, running continuously, and today they mainly burn methane gas. Their plan is to switch to low carbon hydrogen, either ‘blue hydrogen’ made from natural gas with carbon capture and storage or ‘green hydrogen’ made by splitting water using renewable electricity. But the central barrier is cost and complexity: hydrogen is still expensive to produce, transport and store, and it requires coordinated investment across multiple industries and public infrastructure.

0 likes • 3d
The UK and other markets slowed down in 2025 for sure.

Dec '25 •
How do we define the "Energy Data Scientist" ?
The term 'Energy Data Scientist' means more than just a Data Scientist who works in an Energy Company. Given the skills that this Skool community teaches, what jobs does the Energy Data Scientist cover?
1 like • 8d
@Raheema Rahman Hello , I would like to add that interviews in the energy sector are very easy and the secret is to create a portfolio of a few software engineering/data science projects related to energy. Simply copy paste the code in the Classroom , and change it slightly and make a realistic study ; seek feedback here. Eg post results. Then you will have a portfolio eg your website, or your Github, with projects. Ideally make a publication (they offer some tips here). Generally energy pays well and once you're in they won't fire you just like it happens in tech all the time .
0 likes • 8d
@Raheema Rahman They advertise here roles. Or you can just look around e.g. linkedin etc. There are hundreds of roles.
8d •
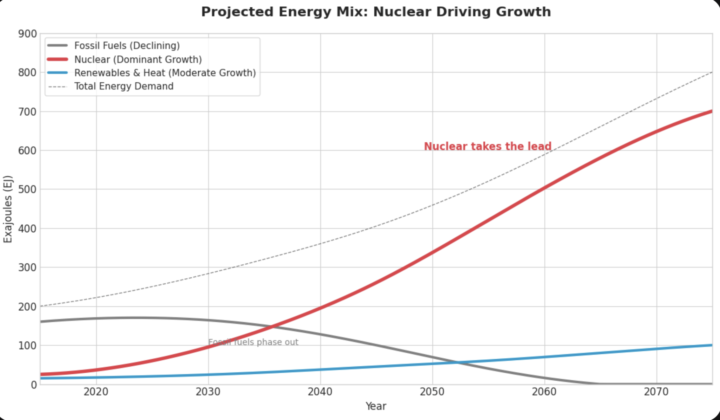
Energy Transition : Adding instead of Replacing
Below is part of some consultancy work I completed recently and sharing a few key ideas: Renewable energy is growing but fossil fuels are still growing too, so the system is adding rather than replacing. Oil and gas will remain important for a long time, so new investment in fossil‑fuel supply and infrastructure (pipelines, power plants, refineries, and other big long‑lasting equipment) will still be needed. If clean energy supply grows faster than total demand for long enough, clean energy first covers new demand and then starts replacing fossil fuels. If clean energy supply keeps outgrowing demand by a few percentage points for decades, fossil fuels will eventually be squeezed out. Real replacement of fossil fuels, not just adding clean energy, is not guaranteed. Most likely we will see 'addition' and co-existence of fuels. This is because the demand is keep rising more and more eg due to AI etc. See the plot .

9d •
LLMs Best Practices
Hey everyone, I’m asking this because LLMs weren’t really part of our workflow before, but now that they’re available it’s difficult not to leverage them given their productivity benefits. How are you using LLMs in data science workflows, and what best practices should I be aware of? Also, from a manager’s perspective, what expectations or concerns do you have about their use? PS: I am one of those that do not use it much especially for work or academia and looking for the correct ways to integrate it.
1 like • 8d
The companies are firing people if they find that they use LLMs at workplace. This is very disappointing because LLMs can help with productivity . Except if they have allowed some AI generation capability in their tools. But generally AI doesn't really help at workplace e.g. in terms of generating code.. You just need to code yourself everything. You need to debug yourself. You need to use Github yourself. AI helps if you go home and generate code, without nobody looking at you. But still you need to read it yourself and understand it, because it is never 100% correct.

12d •
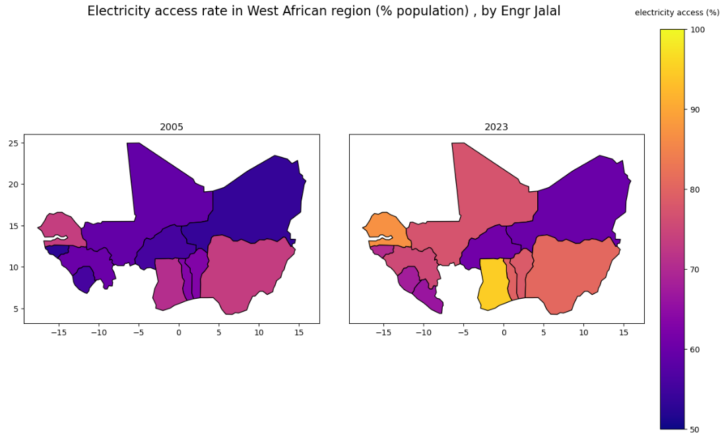
Electricity Access in West Africa: 2005 → 2023
This weekend I visualized how electricity access has changed across West Africa over the last 18 years — and the progress is striking, though uneven. Ghana – Near-universal access. A regional benchmark. Côte d’Ivoire – Strong, consistent growth into the top tier. Nigeria – Big improvement, but population size keeps the gap wide. Senegal – Solid gains driven by energy reforms. Mali & Burkina Faso – Progress, but still constrained by infrastructure. Niger – Improvement visible, yet access remains very low. Sierra Leone & Liberia – Large relative gains from low starting points. West Africa is advancing — but where you live still determines whether you have power. I’m excited to continue exploring how data can drive better decisions in energy, development, and policy. Which country’s progress surprised you the most? Data source: World Bank
1 like • 12d
Dear sir, thank you a lot. Think about the impact on education that this map represents. Students in the 'yellow' zones can study at night, while those in the 'purple' zones are limited by daylight. Closing this energy gap is literally the same thing as closing the education gap in West Africa.
1 like • 12d
@Reza Hashemi I would add that the recovery in Sierra Leone and Liberia is heartwarming to see. Starting from such a low base after civil conflicts and health crises is incredibly difficult. Even small relative gains there represent a massive improvement in the daily quality of life for families.
1-10 of 24

@a-khan-9461
PhD candidate in energy finance / derivatives
Active 3d ago
Joined Nov 2, 2025
ISFJ
PK