Activity
Mon
Wed
Fri
Sun
May
Jun
Jul
Aug
Sep
Oct
Nov
Dec
Jan
Feb
Mar
What is this?
Less
More
Owned by Dr. Spyros
Build true expertise in energy economics: Applied models (ML & Optimization), executive market intelligence, 1-on-1 mentorship & Career Strategy.
Memberships
213 contributions to The Energy Data Scientist

1d •
Interactive Map with Energy Projects
Found and sharing an interactive energy infrastructure map hosted by GlobalGrid2050. It maps renewable energy and storage projects for the United Kingdom only. It is including solar PV, onshore and offshore wind, and battery storage . It is getting them from the UK's Renewable Energy Planning Database (REPD). You can filter projects by technology type, planning status (from "in planning" through to "operational"), and capacity range in MW. It also overlays grid infrastructure like substation density and water utility locations. It is a useful tool for visualising the spatial relationship between generation, storage, and network assets. https://globalgrid2050.com/repd_atlas_grid_model/

0 likes • 1d
@Carlos González Hmm interesting @Muriel Shum king
2 likes • 1d
@Carlos González interesting @Sakeenah Aderinto ( I had seen a similar project hiring for analysts to create similar maps on Streemlit )
2d •
New Career Intelligence Report: The Energy Consulting Landscape (12-Page Breakdown)
I have just uploaded a new 12-page career intelligence brief detailing the specific consultancies in the energy sector currently offering analyst roles. Building advanced computational models is only half the equation. The other half is knowing exactly which top firms are actively looking to hire these quantitative skills in the market. This report is designed to bridge that gap. For every firm listed, the report outlines their specific energy focus, the exact graduate opportunities available, and the regions they hire in. - It is available to download. Where to find it: The PDF is now live in the Classroom (Page 5). Navigate to: Career Strategy & Interviews --> 2. Company Profiles & Intelligence --> 2.4. Consultancies in the Energy Sector.

2d •
How Climate Policy Shapes Energy Markets
I was reading this paper about how climate-related news and policy changes affect the financial stability of both fossil fuel and clean energy markets. It says that major political events, such as the U.S. withdrawal from the Paris Agreement or international climate summits, create short-term volatility and long-term price shifts across the entire energy sector. Also that market prices are driven much more by people's expectations of future climate policies rather than actual physical events like natural disasters.
0 likes • 2d
Very interesting paper and key points.
Oct '25 •
📌 START HERE: Exclusive Benefits for Subscribers
Welcome! I created this Academy with one specific goal: to help you build true expertise in energy economics and secure a high-paying role in the energy sector, whether you are a complete beginner or an established professional. Upgrading to Premium unlocks my complete training and mentorship ecosystem: 1. Personalized Curriculum: I will design a specific learning path that aligns exactly with your CV, existing skills, and career goals. 2. Applied Industry Code: Download production-grade code. You get access to applied models built from the ground up using the exact methodologies deployed in the energy sector. 3. Daily Mentorship: You will never get stuck. Ask questions daily as you work through the models, and I will personally answer them within 24 hours. 4. Executive Market Intelligence: Read a weekly executive report on critical macroeconomic trends. It includes downloadable market diagrams and official citations (Financial Times, Bloomberg, etc.). 5. Career Strategy: Optimize your CV and cover letter with my direct feedback, access a database of real interview Q&As, and discover curated job openings in the sector. 6. The Certification Challenge: Complete a real-world energy consulting project to earn your Energy Data Science Certification and unlock exclusive benefits, including a personalized LinkedIn recommendation, the authorization to include me as a formal reference on your CV, and a potential publication co-authorship. 🚀 Subscribe here to unlock the Academy: https://www.skool.com/software-school-for-energy-7177/plans Best regards, Dr. Spyros Giannelos | PhD in Energy, Imperial College London Email: [email protected] Research: Google Scholar (45+ publications, 1300+ citations) Newsletter: The Energy Data Scientist Corporate & Team Training: www.energydatascientist.com
6 likes • Dec '25
@Abdullah Bankole Welcome! MTech in AI and Control Engineering sounds great! I guess you are very busy with the studies. It must be very demanding I guess ? I strongly recommend you take some courses on energy also. Because you will be able to apply to energy jobs as well. These jobs need your skills in AI / Control but they will be impressed if you also show knowledge of energy! They look great on your CV! The Energy Sector offers great job security ,, high salaries , and a very interesting work context (you do not only code! But you also develop an interest in the wider energy/ economics domain) . I will be sending you a message with some more details about the curriculum!
0 likes • 3d
@Francisco Rivas-Dávalos Welcome to the community, Professor Rivas-Dávalos. I have just sent you a direct message to get you immediate access to the specific computational models your research requires
5d •
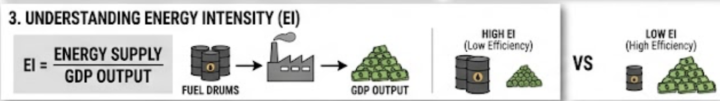
🚨 NEW EXECUTIVE BRIEF: Energy Intensity & The Impact of Oil Shocks
Here is the macroeconomic breakdown from our latest intelligence report: Oil price shocks (such as disruptions at the Strait of Hormuz) hurt developing economies far more than richer ones. Why does this happen? Because developing countries use more energy per unit of economic output and depend heavily on imported fuel and industrial inputs. Richer economies have steadily improved their energy efficiency since 1990 by shifting toward services, while developing economies remain stuck in energy-intensive manufacturing. Furthermore, because oil and gas are key inputs for fertilizers, chemicals, and plastics, a fuel shock rapidly ripples into food security and industrial production, widening the economic gap between rich and poor nations. 🔑 KEY CONCEPT: Energy Intensity (EI) The attached screenshot illustrates Energy Intensity—the ratio of energy supply to GDP output. Essentially, it measures how much energy an economy consumes to produce a unit of economic value. 🔻 High EI (Low Efficiency): Lots of fuel is needed to generate GDP (represented by a large barrel with a small money pile). 🟢 Low EI (High Efficiency): A small amount of energy produces a large pile of economic output (represented by a small barrel with a large money pile). 📊 DOWNLOAD THE REPORT: Head over to the "Energy Market Intelligence" section inside the Classroom tab to download the full PDF. The report includes all downloadable market diagrams and official citation links (Financial Times, WSJ, Bloomberg).
1-10 of 213

@sp-ia-8683
PhD in Energy, Imperial College London | 10+ years of applied research | I help you build applied quantitative energy skills and advance your career
Online now
Joined Aug 20, 2024
London, U.K.