
Pinned

🔥
3d •
🏆 Weekly Wins Recap | June 27 – July 3
From $40K AI projects and first clients to custom CRMs, AI operating systems, and production-ready automations, another week inside AIS+ proved that consistent building keeps creating opportunities. 🚀 Standout Wins of the Week inside AIS+ 👉 @Kobe Shemesh closed a $40K upfront AI project after refining his Claude Code workflow, proving that small improvements in execution can create massive business results. 👉 @Galyn Fergerson landed her first client just 6 days into AIS+, turning a discovery call into a $750 AI OS project before even finishing the automation course. 👉 @Girish Mohan built an AI Scrum Master that now prioritizes his calendar, tasks, and deals automatically—helping him execute every day with more focus. 👉 William Rendall was promoted to AI Workstream Strategy Lead less than three months after joining AIS+, crediting the community for accelerating his growth. 👉 Diane McCracken celebrated her 100th Claude Code session at 68 years old, showing that curiosity and consistency matter far more than experience. ⸻ 🎥 Super Win Spotlight | @Ahmad Abd Alkarim Ahmad joined AIS+ with years of leadership experience but wanted a better way to turn ideas into action. Today, his custom AI Operating System helps him manage projects, analyze business problems, and support his team without slowing anyone down. His biggest lesson? Don't just watch. Build. Practice. Share what you learn. That's where the real return comes from. 🎥 Watch Ahmad's story 👇 ✨ Every week, members are turning ideas into systems, skills into businesses, and momentum into real opportunities. Step inside AI Automation Society Plus and start building assets, systems, and skills that compound 🚀

Pinned

💎
⭐
Jun 3 •
What do you get if you upgrade to AIS+?
Some of you have never heard of the AIS+ community. Others have but the part that trips you up is the actual difference between the two. Either way, this post will give you clarity. This free group is a bundle of quick resources pulled from my YouTube videos, plus a massive open community that anyone can join. It's a great place to get your bearings and see what's possible. But it's open to everyone, it can be noisy and overwhelming, and there's no path through it. You can get help from other members, but I rarely answer questions here. AIS+ is the opposite: - A step by step roadmap with a clear order, so you're never guessing what to do next - A much smaller community of people who are seriously committed to building and selling AI agents - I answer questions every day and run a weekly Q&A call where you can get direct access to me For the course material: The roadmap takes you from zero to building and selling AI agents, and the whole thing is built on the latest tech like Claude Code and Codex. We update it constantly. The old n8n material has been archived. It's still there if you want it, but it's no longer the focus, because the way you build today has moved on and the courses moved with it. Here's the actual roadmap inside, in order, with when each piece opens up: 1. Start Here (opens the moment you join). Gets you oriented. How the community works, the path ahead, and how to get help when you need it. 2. Build Your Portfolio (opens the moment you join). Why a portfolio matters, beginner level tutorials, and what types of projects to focus on. You end up with real work you can show a client. 3. Claude Code (opens the moment you join). This is now its own dedicated course. Build faster, turn ideas into working automations, and go deep on the tool serious builders are using right now. This takes you from beginner to advanced, step-by-step. 4. Get Your First Clients (opens after 30 days). Getting your first clients is hard, because you don’t have any case studies yet. So, we analyzed all of the success stories from our members and found they get their initial clients with two different techniques: warm outreach and Upwork. So, we teach both techniques in detail with exactly what to say, exactly how to position yourself when you have no proof.
Pinned
💎
⭐
10d •
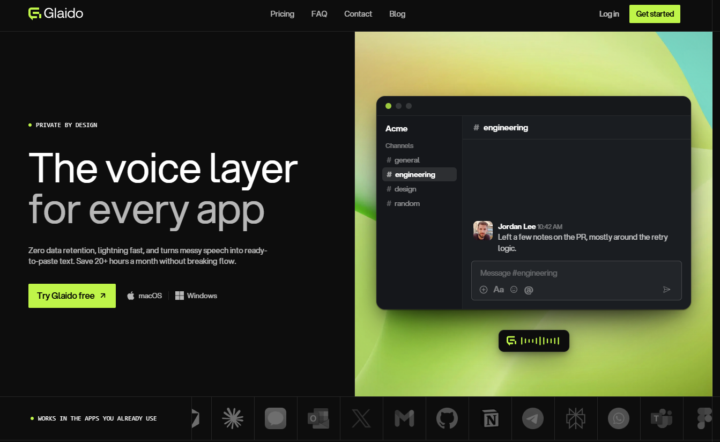
🎉LIMITED TIME try Glaido FREE, then 40% off.
I'm a co-founder of Glaido, building it with Jack Roberts, Dave Ebbelaar, and Jannis Moore. It's a voice tool built around two things: speed and privacy. Fastest on the market, completely private. It used to be Mac only. It's now on Windows too, so all of you can use it. You get 40% off your first 3 months ($20/mo → $12/mo) with this code: D5J6BIF8K4P Next 30 days only 👉 https://get.glaido.com/nate I switched from Wispr Flow a few months ago and it just felt better. If you're on Wispr, try Glaido free, use the code, and tell me if you feel the difference. If you want to switch back after, no hard feelings. Good to know - Mac + Windows - Snippets: insert any text instantly with one word - Dictionary: save your own words, import straight from Wispr Flow - Agentic Mode: manipulate any text on your screen with your voice - Webhooks coming to Agentic Mode soon (huge) - We action feedback almost immediately Give it a shot and drop your thoughts in the community.

just now •
My Six-Month Cancer Research Journey: From Broad Exploration with Grok to Building a Comprehensive Global Cancer Database
Over the past six months, I embarked on an intensive cancer research project that evolved from broad conceptual exploration to sophisticated data engineering. The journey began with Grok and later accelerated dramatically with Claude AI combined with coding capabilities. 1. Research of Cancer through Grok (Months 1–4) • Opened a dedicated long-term project in Grok and systematically asked nearly 300 questions to understand the full scope of cancer — from molecular mechanisms, tumor heterogeneity, metastasis pathways, and the central dogma (DNA → RNA → Protein) disruptions, to clinical challenges in early detection and treatment resistance. • Explored key technologies including microfluidic biochips, single-cell separation, CTC isolation, immunofluorescence, NGS/PCR downstream analysis, and the differences between liquid and tissue biopsies. • Investigated global cancer epidemiology, existing detection platforms (e.g., CellSearch, CytoAurora CMS), and the limitations of current data sources. • Although Grok provided valuable structured explanations and technical depth, the process required extensive manual follow-up, repeated clarification, and cross-validation because cancer research involves highly interconnected, multi-disciplinary knowledge. 2. Data Research and Collection (Months 3–5) • Discovered that global cancer data is highly fragmented across sources (WHO, IARC, GLOBOCAN, national registries, academic papers). • Most datasets offered only country-level incidence, mortality, and prevalence, with inconsistent years (some limited to single years like 2002) and varying formats. • Collected raw data from multiple sources and categorized them into two tiers: • 1.0 Comprehensive Data: Full incidence, mortality, and prevalence figures with metadata. • 0.5 Percentage Data: Derived or estimated percentages generated or validated through Grok. • Performed extensive data cleaning to standardize country names, cancer types, and units. 3. Data Integration through Excel, Power Query, Power BI and DAX (Months 4–6)
0
0

🔥
2d •
Build = ecommerce product listing
now I am back with continue building with n8n again!! Claude + N8N =💪🏻 Been building something I think will help people here: An automation that lists one product across Shopify, WooCommerce, and Amazon at the same time — straight from a spreadsheet. The problem I kept seeing: sellers manually re-typing the same product into 3 different platforms, and prices/descriptions drifting out of sync between them. Here's the basic flow: 1. Add the product to a sheet 2. It validates the data automatically 3. It lists on all 3 platforms and retries if one fails Result: what used to be 3 manual listings is now 1 spreadsheet row. If you sell across multiple platforms and this would save you time, let me know — happy to share more details or answer questions 👇 Questions :- 1. any add-ons ? 2.what you are building??

1-30 of 20,902
skool.com/ai-automation-society
Learn to get paid for AI solutions, regardless of your background.
Leaderboard (30-day)
1
🔥
+7641
2

+6363
3

🔥
+6003
4

🔥
+5479
5

🔥
+1948
Powered by