Activity
Mon
Wed
Fri
Sun
Feb
Mar
Apr
May
Jun
Jul
Aug
Sep
Oct
Nov
Dec
Jan
What is this?
Less
More
Memberships
School of AI
908 members • Free
Make $1k-$10k in 30 days
13.6k members • Free
21 contributions to Make $1k-$10k in 30 days

20h •
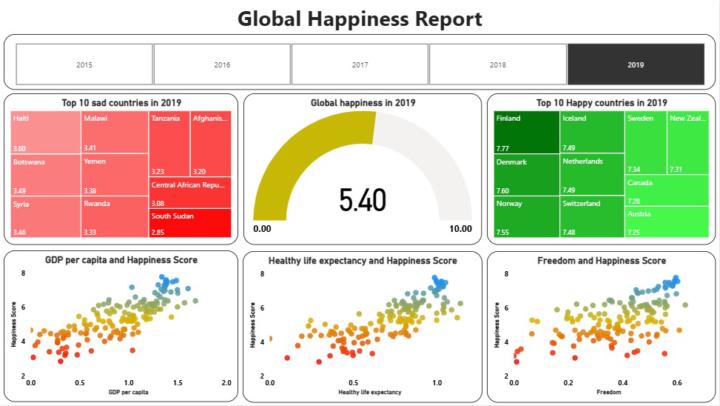
Data Analytics Project 25 : Power BI Global Happiness Report
Data Analytics Project 25 : Power BI Global Happiness Report This report analyzes well-being across countries by combining economic, health, and social indicators. This interactive dashboard focuses on 2019 data and enables a clear comparison of global leaders and laggards in happiness, helping uncover the key drivers behind overall life satisfaction worldwide. One of the main KPIs highlighted is the Global Average Happiness Score, which stands at 5.40 out of 10, visualized through a gauge chart. The dashboard also ranks the Top 10 Happiest Countries, led by Finland with a score of 7.77, followed by Denmark, Norway, Iceland, and the Netherlands. On the other end, South Sudan records the lowest happiness score at 2.85, emphasizing significant economic and social challenges. The report includes detailed correlation analysis using scatter plots. A strong positive relationship is observed between GDP per capita and happiness score, showing how economic prosperity contributes to well-being. Similarly, higher healthy life expectancy and greater personal freedom are both associated with increased happiness levels. Built using Power BI, Power Query, and DAX, this project demonstrates data modeling, ETL, KPI creation, and data storytelling skills. It showcases how data visualization can turn complex global data into actionable insights. Power BI Service Link : https://app.powerbi.com/view?r=eyJrIjoiYzA3Y2Y3NmQtYmQwOS00MWU3LTg5NDktZjlmY2QxM2E0M2FmIiwidCI6IjZlNTk3ZjY4LWM4YmEtNGI2Yi1hNTY3LTJlNjc3YTQ2ZTMwZCIsImMiOjl9 GitHub Link : https://github.com/Talal-Bin-Zahid/Power-BI-Global-Happiness-Report

0 likes • 4h
can you guide me how can i learn powerbi roadmap and heplful material


0 likes • 4h
@Anwar Ali Any update about course sir
0 likes • 4h
@Tabassum J what about AI fundamentals classes

9h •
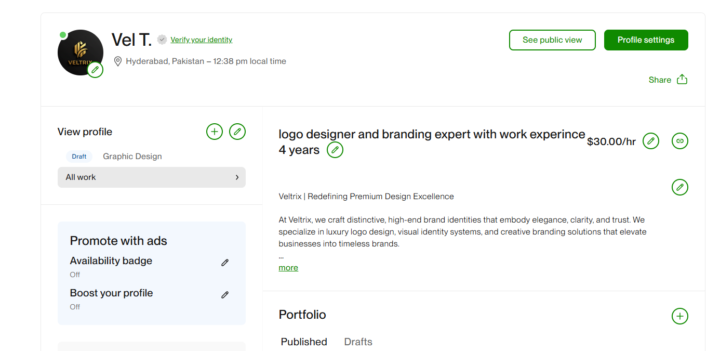
Alhamdulillah: A New Step in My Freelancing Journey
Alhamdulillah 🤍Allah Ta’ala ka bohot bohot shukar hai ke aaj main ne Upwork par apni profile create kar li hai.Yeh mere freelancing journey ka ek chhota lekin important step hai. Is journey me Harron Bhai ki guidance ka bohot role raha hai 🌟Unki sincere baatein, practical advice aur Islamic reminders ne mujhe direction aur motivation di. Main Media Valley community ke respected members se humble request karta hoon keagar aap meri Upwork profile dekh kar koi suggestions, improvements ya changes recommend karein(jaise profile description, skills, portfolio ya gigs),to mujhe bohot faida hoga. Aap sab ki guidance mere liye bohot valuable hai,aur InshaAllah main un sab tips par amal karne ki poori koshish karunga. Allah Ta’ala hum sab ke ilm aur mehnat me barkat daale 🤲✨ https://www.upwork.com/freelancers/~012595976232ea08fc?mp_source=share
0 likes • 4h
keep it up

4d •
Assalaam o alaikum
@Haroon Khalil Sir Please share an update about the AI Automation recorded Classes and new classes or schedule. Kindly guide us. Thank you.
0 likes • 4d
I am also waiting for announcement

5d •
English writing Mistake I will never repeat again.
Kuch din pahle may ak group k admin sy serious discussion kr raha tha or may ny ak writing mistake krdi ( wow I got my mistake now I improve myself one more step up its my win ) may ny chatgpt sy apni baat Khud sy to bari koshish kr k professionaly re write krwa li but ak Chez note nahi ki or remove krna bhool gya ku k uspy itna focus nahi krta tha may but now may uski daily practice krta hu k again mistake na ho. Hum aisi baty note nahi krty lkn international log bohat krty so learn and improve this is for all Community members apni writing may ye chezy lazmi note kry. Punctuation mistake thi so niche punctuation name with sign and with use mention hai ap isko copy paste kry or practice kry for better writing. 📌 Full stop / Period → . Jumla khatam karne ke liye. I like apples. 📌 Comma → , Jumlay mein chhoti rukawat ya items alag karne ke liye. I bought apples, oranges, and bananas. 📌 Exclamation mark → ! Shock, khushi, ya surprise dikhane ke liye. Wow! That’s amazing! 📌 Question mark → ? Sawal poochne ke liye. Where are you going? 📌 Colon → : List ya explanation shuru karne ke liye. I need three things: pen, notebook, and eraser. 📌 Semicolon → ; Do related jumlay join karne ke liye. I like tea; my brother prefers coffee. 📌 Apostrophe → ' Possession ya contraction ke liye. Sara’s book (Sara ki kitab) I’m happy (I am happy) 📌 Quotation marks → " Kisi ka quote ya bol chaal dikhane ke liye. She said, "I am tired." 📌 Parentheses → () Extra information ya clarification ke liye. He finally answered (after thinking for a long time). 📌 Hyphen → - Compound words banane ke liye ya word split karne ke liye. Well-known author 📌 En dash → – Range ya relation dikhane ke liye. The London–Paris flight is 2 hours. 📌 Em dash → — Strong pause ya explanation ke liye. I went to the store—finally!—and bought milk. 📌 Ellipsis → … Pause ya incomplete thought dikhane ke liye. I was thinking… maybe we can try later. 📌 Slash → / Alternatives ya fractions dikhane ke liye. and/or 1/2
1 like • 4d
thanks for sharing
1-10 of 21
