
Write something

1d •
NQ & SPX — What I'm Watching 2/13/2026
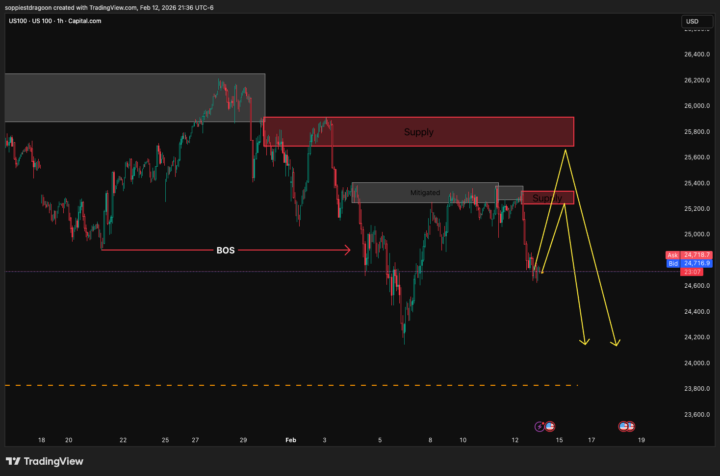
I've got two index short setups on my radar. Both hinge on the same concept: wait for price to reach supply, then look for lower timeframe rejection. Here's what matters: THE STRUCTURE: NQ has supply in the upper 25Ks. SPX has cleaner supply just below 7K. Both are zones where sellers could step in if price rallies into them. WHAT I'M WATCHING: IF price trades into these supply zones → I'm watching 5m/15m for distribution signals IF distribution confirms → I'm interested in shorts IF price blows through → No trade, thesis wrong THE DIFFERENCE: NQ requires scaling (multiple targets). SPX is simpler—one target, one exit. Pick based on how much management bandwidth you have. THE EDGE: This isn't "short now because I said so." It's "know where supply sits, wait for price to get there, then look for confirmation." No chasing. No guessing. REMEMBER: Structure tells you WHERE to pay attention. Price action tells you WHEN to act. 🔒 Trading Desk members have the exact entry zones (not "upper 25Ks"—actual levels), precise stops and targets, plus they'll get real-time updates when price approaches these zones. Learn the method here. Execute with support there. → https://www.skool.com/the-trading-desk-2388/about
0
0
2d •
How This Weekend’s S&P / US100 Plan Played Out (And What To Learn From It)
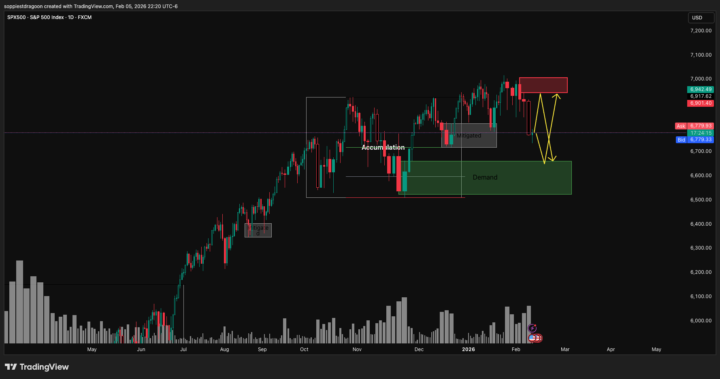
This weekend I shared how I was framing risk on S&P 500 / US100. The goal wasn’t to “call the top,” it was to define: - Where supply would actually matter, and - Where downside would make structural, not emotional, sense. Here’s what I laid out: - We had a clear bearish impulse on the daily, showing sellers taking control - Recent demand was already partially mitigated, which weakens its ability to hold - I marked 6945–7006 as a key supply zone to watch if price retraced - I flagged 6524–6662 as the next meaningful demand zone, where further downside would make structural sense What happened next: - Price pushed back up into the 6945–7006 supply zone - On lower time frames, we saw distribution, a liquidity sweep, and then a break of structure to the downside, remitigating lower TF supply Here’s the important part: I did not catch this move live. I wasn’t at the charts when it triggered. But the analysis and structure held up exactly as planned. For you as a 9–5 trader, the lesson is: - Your job is to have a clear, rules-based plan in advance - You focus on zones, structure, and risk, not feelings or headlines - You measure progress by “Did my read make sense?” not just “Did I catch every single move?” If you want to see these kinds of plans before they play out and learn the exact No‑Chase Swing Method I use to trade around a full-time job in under 30 minutes a day, that’s what we work on inside The Trading Desk.
0
0
8d •
How I’m Thinking About This “Irrational” Market (pulled from the Desk)
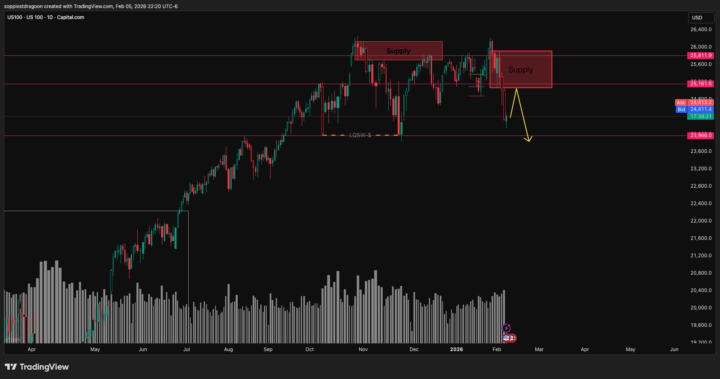
A lot of you have been DM’ing and commenting variations of: - “Is this the top?” - “Should I just go to cash?” - “Why does nothing make sense right now?” Rather than give you a one-liner, I wanted to show you exactly how I walked Desk members through this environment today. This is taken straight from our paid Trading Desk, but I’m sharing it here because: - The market is emotional and confusing for a lot of 9–5 traders right now - Seeing the process for how I frame risk, structure, and opportunity matters more than any one hot take Use this to slow down, zoom out, and make decisions from structure instead of fear. . . . . . MARKET CONTEXT UPDATE — HOW I’M THINKING ABOUT RISK RIGHT NOW S&P 500 vs US 100 I want to walk you through how I’m reading this market, not to predict what happens next — but to show how I frame risk, structure, and opportunity when conditions shift. __________________________________________________________________________________________ STEP 1: START WITH THE BROAD MARKET (S&P 500) Today’s session produced a clear bearish impulse on the daily candle.That matters — because impulse tells us who’s in control right now. - Sellers showed initiative, not just reaction. - This shifts my short-term mindset from “support first” to “where would supply matter?” What I’m watching: - Supply: 6945 – 7006 If price retraces here, I’m paying attention to seller behavior, not blindly shorting. - Demand:The most recent demand has already been partially mitigated. To me, that reduces its ability to act as strong support. - Next valid demand: 6524 – 6662This is where downside would begin to make structural sense, not emotional sense. Key point: I’m not bearish because price went down. I’m cautious because structure changed and prior demand weakened. __________________________________________________________________________________________ STEP 2: CHECK LEADERSHIP (US 100 / TECH) This is where the message gets clearer.
2d •
DUOL — What I'm Watching 📊
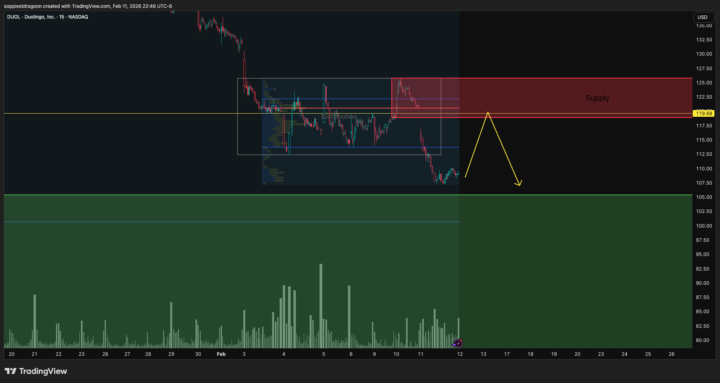
Duolingo is sitting inside a distribution pattern with clean supply overhead. Here's what matters: THE SETUP: Price is in imbalance with HTF supply in the upper range around 119-126. Point of control is mid-range. If we get re-mitigation of that supply zone, there's potential for shorts targeting lower swing structure down to psychological 100. WHAT I'M WATCHING: IF price re-mitigates the supply zone → I'm interested in shorts targeting swing lows IF price breaks above supply → Distribution thesis broken, no trade THE EDGE: This isn't a "short now" — it's a "know where to wait for the retrace" setup. Supply sits above, so we need price to come back to us. Patience over prediction. REMEMBER: Structure tells you WHERE. Price action tells you WHEN. 🔒 Trading Desk members have the exact supply zone, stop placement, and precise targets. They'll get real-time updates as this develops. Learn the method here. Execute with support there. → https://www.skool.com/the-trading-desk-2388/about
0
0
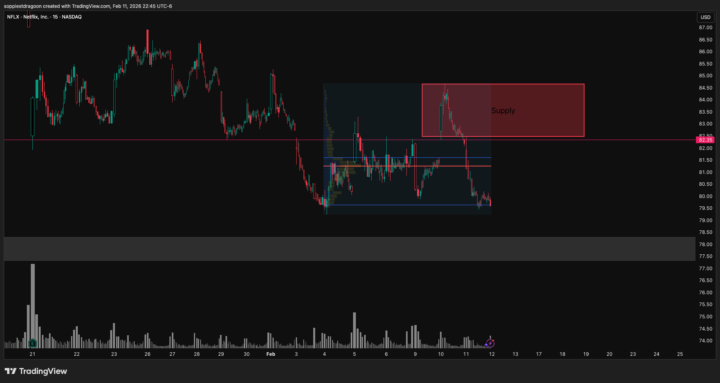
2d •
NFLX — What I'm Watching 📊
Netflix just rejected a key level and created fresh supply. Here's what matters: THE SETUP: Price rejected hard off 82.30 today and printed a new supply zone. There's inefficiency sitting below around 78 that could act as a magnet if this rejection holds. Clean structure for a potential move lower. WHAT I'M WATCHING: IF price retraces back into that supply zone → I'm interested in shorts targeting the swing low IF price accepts above the supply → Thesis is off, no trade THE EDGE: This isn't a "short now" — it's a "know where to wait" setup. The supply zone sits above current price, which means we need patience for the retrace. No forcing. No chasing. REMEMBER: Structure tells you WHERE. Price action tells you WHEN. 🔒 Trading Desk members have the exact entry zones, stop placement, and precise targets. They'll get real-time updates as this develops. Learn the method here. Execute with support there. → https://www.skool.com/the-trading-desk-2388/about
0
0
1-30 of 140
powered by
skool.com/nochase-swing-watchlist-2326
Free swing‑trading school for 9–5 pros who want clear levels, rules, and less screen time using the No‑Chase Swing Method.
Suggested communities
Powered by