

🔥
10h •
A Video Is So Powerful
After seeing a surge of authors in my community wanting a video review, it made me realize how powerful a video is. If you can get your customers to leave a video review that would be great, but the truth is it is hard to get a customer to leave a review at all. Fortunately, you can work with Amazon Influencer to create a shoppable video for you. A shoppable Video is completely different than a customer review, but it Allows you to be able to have a video of your book sitting on your product page. Check out the short video below. You can see a demonstration of what a typical shoppable video review I do look, and if you have a product on Amazon that you want some more visibility on, let's connect. @Sybil Hall invited me to post about shoppable videos here. 💜
🔥
12d •
UPDATE: Tess is the #1 Best Seller in 3 categories: A Simple KDP Strategy Worth Trying 👀
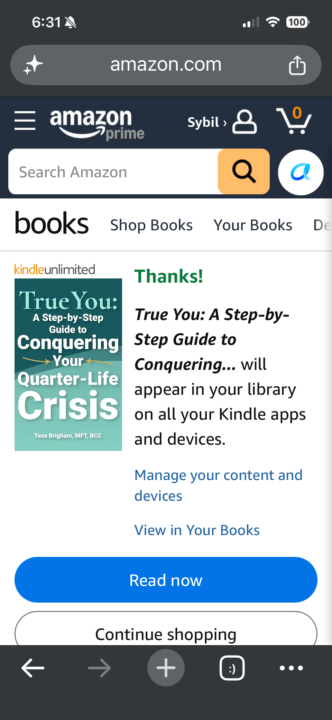
UPDATE: Tess is the #1 Best Seller in 3 categories right now!!! Go check it out. Scroll down to product details and click through to see what the status looks like! Be aware that it changes frequently. https://www.amazon.com/gp/product/B0DTJ8W2MM One of our VIP members, @Tess Brigham, is doing something smart that I wanted to share because it’s a strategy you can absolutely replicate if you publish on Amazon KDP. She’s running a Kindle Select free promotion for a few days. The goal isn’t just free downloads. It’s to: - Increase visibility in Amazon’s rankings - Get more readers - Earn more reviews - Build momentum that can carry over after the promotion ends I used this strategy myself on my books first birthday, and it helped me earn a bestseller badge. It doesn’t guarantee results, but when you combine a free promotion with your community and email list, it can be a powerful way to build traction. If you’d like to support Tess, her book is currently free to download through July 3. 📖 True You: A Step-by-Step Guide to Conquering Your Quarter-Life Crisis If you know a 22 to 35 year old who’s feeling stuck, burned out, or unsure of their next step, this could be a great resource to share with them too. If you read it, consider leaving an honest Amazon review a few days after downloading. Reviews are one of the biggest gifts you can give an author. I’d also love for you to look beyond this specific promotion and notice the strategy. Building an audience that shows up for your launches is one of the most valuable assets you can create. Have you ever used a Kindle Select promotion? Or if you’re planning to publish a book, would you try this strategy?
🔥
20d •
🚨 Amazon Prime Days are June 23-26!
If you sell on Amazon, now is a great time to add a sale price to your products. You don’t need a huge discount. Even a couple of dollars can create that red strike through price that catches shoppers’ attention and can help improve conversions. To update your price: ✅ Go to Manage Inventory ✅ Find your product ✅ Type in your sale price ✅ Scroll to the bottom of the page and click Save For books: ✅ Go to your Bookshelf ✅ Edit price A small discount can go a long way during a high traffic shopping event like Prime Days. Are any of you running Prime Day pricing this week?

🔥
Jun 7 •
📚 I read as a learner and as an author
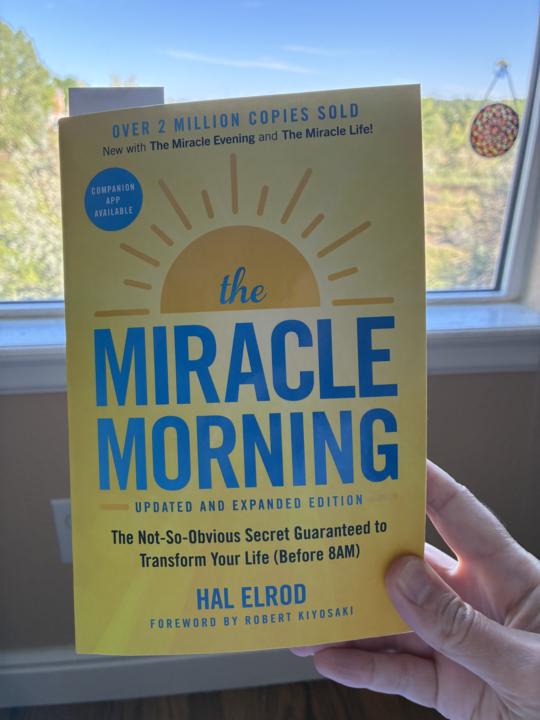
One thing I’ve been trained to do my whole career as an educator is pay attention to what authors do. As a teacher, I taught kids to notice author’s craft and try the techniques in their own writing. And as an author, I can’t help but do the same thing when I read. This weekend I started The Miracle Morning and by page 2 (there are lots of sections before the book starts!) I had already pulled out my notebook and made a T-chart. On one side: Content On the other: Author Moves Under Content, I captured this quote: “I would argue that becoming the best version of ourselves and creating the life we want is what should be focused on each day.” Under Author Moves, I noted: 1. First spread: Watch the movie (QR code) 2. First spread: Download the app (QR code) 3. Real-life stories of transformation and testimonials 4. Invitation to join the community after I’m hooked by the introduction and can’t wait to keep reading more! I find it fascinating to learn from both sides at the same time. What is the author teaching? And what is the author doing? The book isn’t just a book. It’s connected to a movie, an app, and a community. Just like many of us are trying to do! Every page is teaching me something about personal growth and something about building a body of work that helps people beyond the pages of a book. As authors and creators, we should be studying everywhere we go. What is one smart thing you’ve noticed recently in a book, course, community, podcast, or product you’ve consumed? Drop it below. 👇
🔥
May 27 •
Oracle Summit Deck Analysis - Research Before You Create ☀️
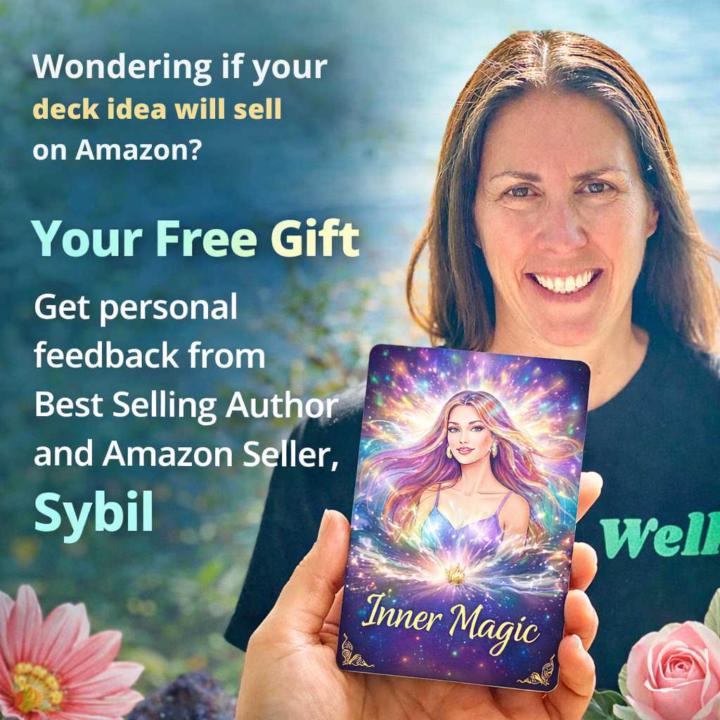
One thing I keep thinking about after speaking in the Oracle Connections recently is this: Creating products is fun. Manufacturing products is expensive. 😅 And inventory sitting in your house, garage, basement, or Amazon storage? Not fun. When we create physical products, we are not just making art or ideas anymore. We are making inventory that eventually has to move. That’s why I’ve become such a believer in researching before creating. Not to kill creativity. To support it with reality. During the summit, I offered a free Amazon Deck Analysis where people could submit their oracle or card deck ideas along with competitor listings. I already have 7 submissions to dig through now. And honestly? The patterns are fascinating already. Some ideas are beautiful but hard to search for. Some have huge competition. Some have low competition because there may not actually be much demand. And some have tiny tweaks that could completely change the likelihood of success. This is the stuff people skip because the creating part is more exciting than the research part. But research is what protects your energy, money, and time. Especially when: ☀️ inventory costs money ☀️ ads cost money ☀️ storage costs money ☀️ manufacturing minimums exist ☀️ Amazon fees exist ☀️ unsold inventory becomes stress One of the biggest lessons entrepreneurship keeps teaching me is this: Do not confuse creating with validating. They are not the same thing. And honestly, speaking in other communities has reminded me how much I enjoy this side of business too. Not just building my own products, but helping people think through whether an idea has actual market potential before they invest thousands into it. I’ll share the interesting lessons and patterns from these 7 reviews here in Income Without Burnout soon, because I think all of us can learn from them, even beyond Amazon. Sometimes, the calmest business move is slowing down long enough to research first. I am dropping all analysis below over the next couple of days! Let's get this conversation rolling!
1-30 of 80
powered by
skool.com/multiple-streams-of-income-4358
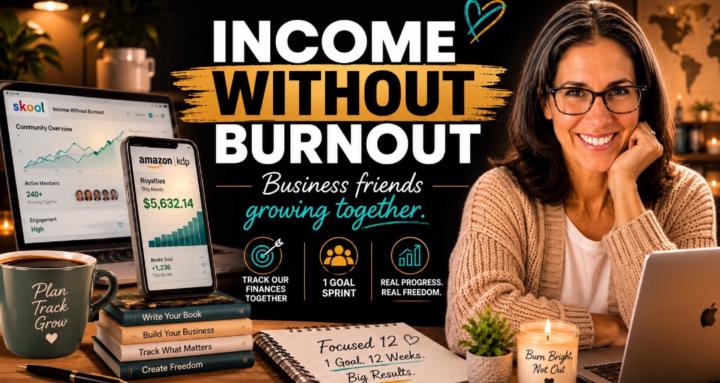
Build sustainable income streams with best-selling author Sybil Hall. Real businesses, real progress, a community growing together 12 weeks at a time.
Suggested communities
Powered by