Write something
📈 MNQ Market Recap: September 24th – Patterns Repeating in Action
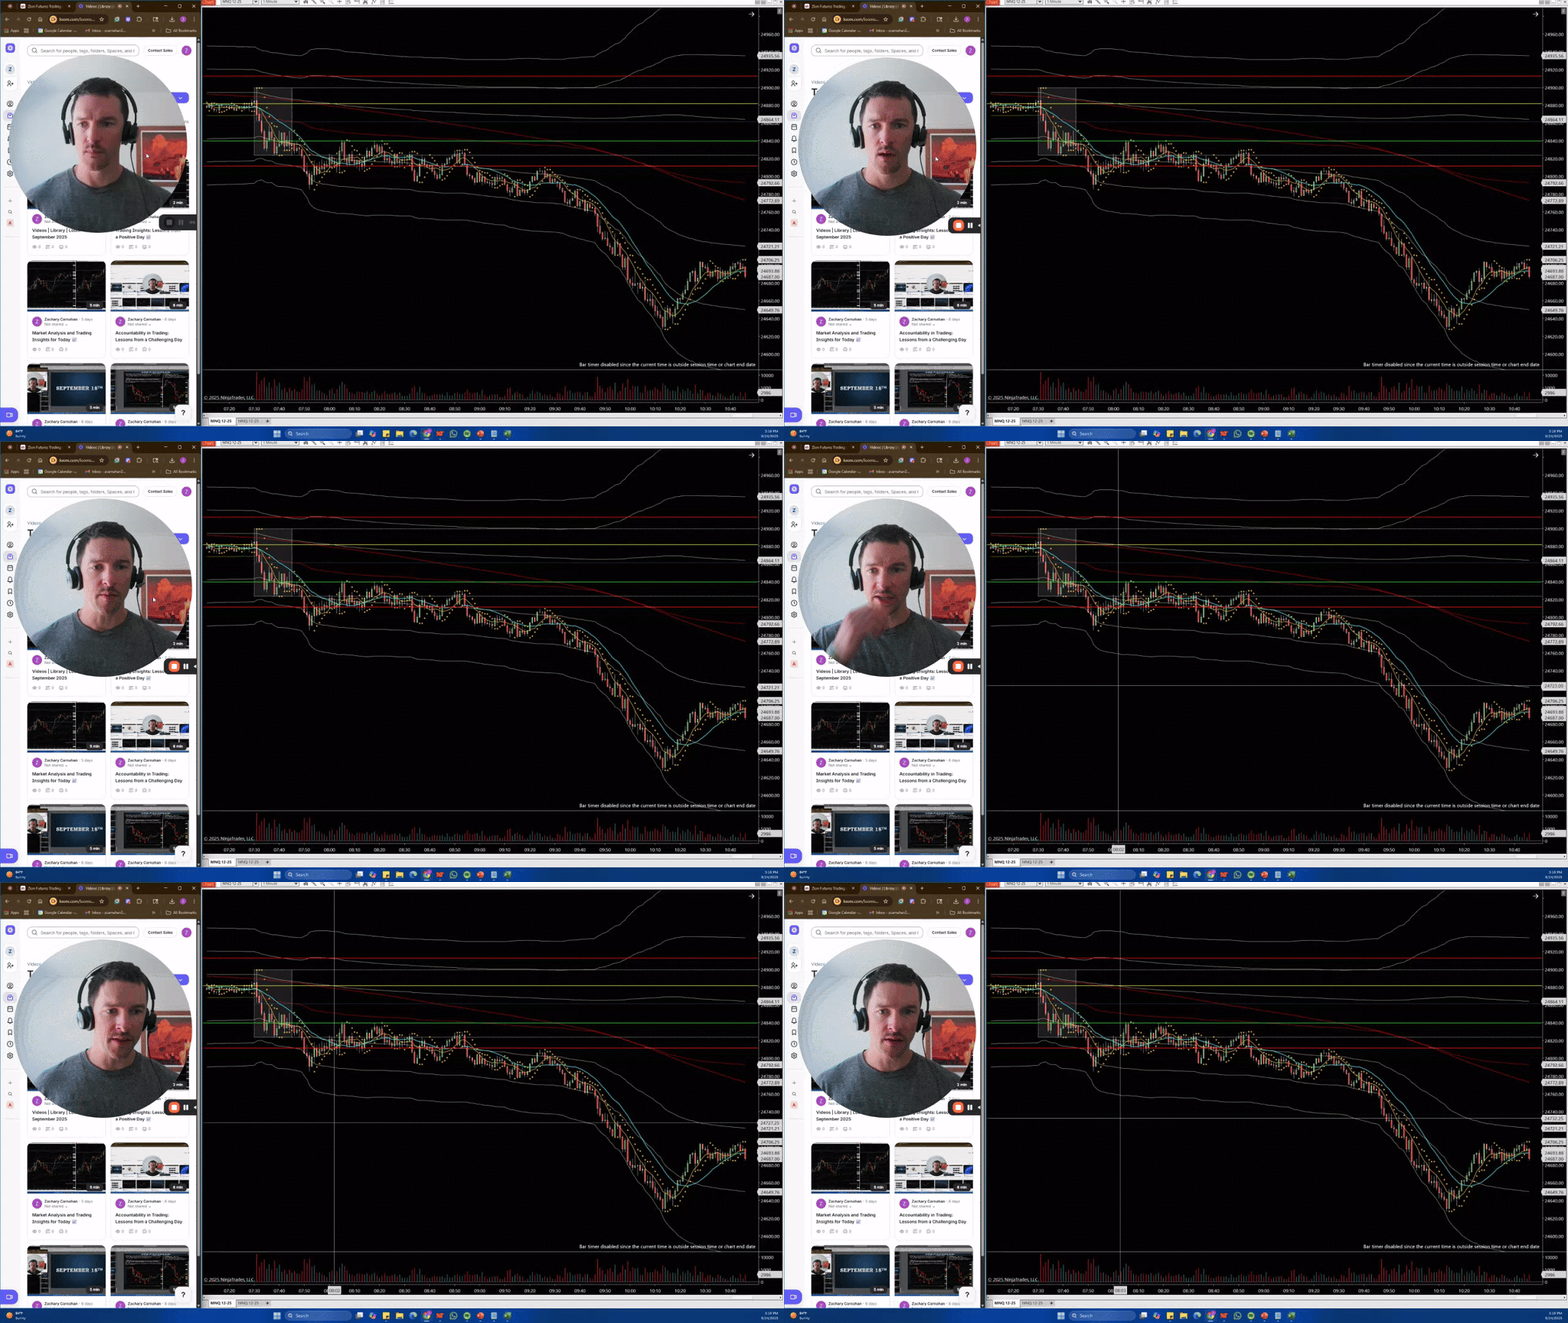
Hey everybody, Let’s dive into a technical look at the MNQ market (micro-NASDAQ) for Wednesday, September 24th. Today’s market structure was strikingly similar to yesterday’s, showing how patterns often repeat. ⏰ Pre-Market Action - Pre-market London High and Asia London Low were visible. - Green line: market low | Yellow line: London open. From the start: - Market initially fell, then rose. - At London open, price retraced to market open, then pushed to new highs before falling again. 📊 Early Market Structure - Attempts to move higher failed; brief consolidation followed. - 20-period moving average caught up, then price dropped further. - Lower highs formed progressively: - Weakness led to a new low at 8:10, ~16 points from the prior high. - Market entered a clear downtrend with selling pressure. 🔁 Comparing Yesterday and Today One-minute charts show near-identical patterns: - Fall from the open → consolidation → failed attempt higher → progressive lower highs → further drop Key takeaway: - Patterns repeat across days. - Prior day’s price action often influences today’s market. - Aligning higher timeframes clarifies possible vs probable moves. ⚡ Key Observations - Consolidation acts as a trend within a range. - Today’s consolidation was shorter than yesterday’s (~1 hour). - Early session bias: slightly downward. - Double-top at the 20-period moving average → series of lower highs. 🧮 Measured Moves - Yesterday: 950 → 780 (~160–170 points) - Today: ~166–178 points - Overlap: ~93% ✅ Trades aligned with patterns: - Price retested 200-period moving average, failed, broke below, then fell. - Today mirrored this with a final failed attempt off the London/Asia low (~8:10) → downside move. 💡 Takeaways - Watch for repeating daily patterns to anticipate setups. - Prior days’ action gives context for today. - Market behavior may not always be volatile; sometimes it’s structured and uniform.
0
0

Trend Channels & Price Action – September 19th 📊
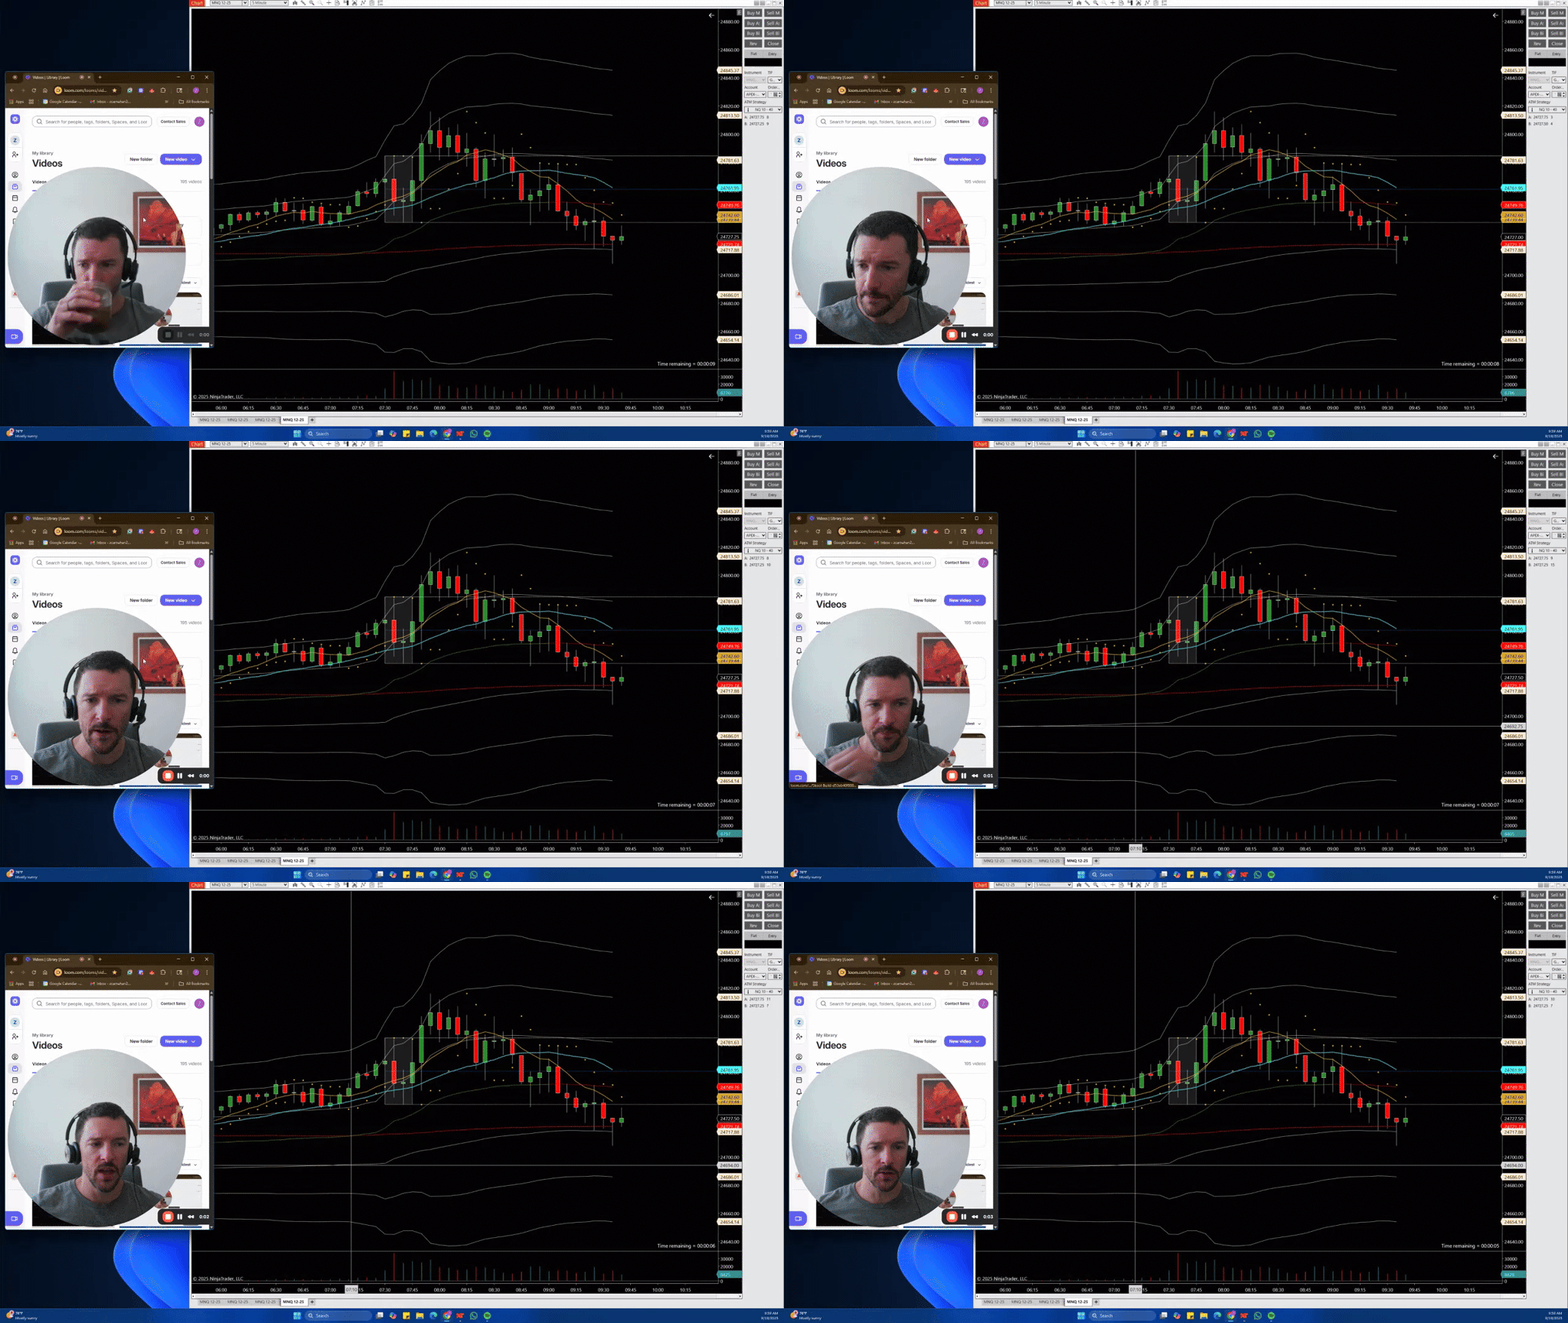
Today’s price action gave us a textbook lesson in trend channels and measured moves. Let’s break it down quickly. 5-Minute Overview ⏱️ - Opened at 4768, dipped into the 20 EMA (solid support). - Initial move up, then the “dance” began around 4785–4790. - Support flipped to resistance → clear downtrend formed. 1-Minute & 2-Minute Insights 🔍 - Early lift above the open looked strong, but selloff was controlled, measured. - On the 2-minute, the trend channel was crystal clear. - Reminder: 80% of reversals fail ❌. The true reversal showed higher highs and a structural shift. Lessons Learned 💡 - Trend channels = controlled consolidation with direction. - Use multiple timeframes (5, 2, and 1) for confirmation. - Dots/indicators = great for mechanical exits → no stress trading. - Measured moves repeat (today gave us several ~50-point legs). Overall, today’s session was a solid reminder: ✅ Stick with the trend. ✅ Expect reversals to fail more often than not. ✅ Let structure guide your risk-to-reward. See you Monday—fresh week, fresh charts! 🚀📈
0
0

1-2 of 2
powered by

skool.com/zion-futures-trading-3124
This space is built to help you master the art and discipline of futures trading.
Suggested communities
Powered by
