
6d • 💬 General discussion
Day 3/5 - Afternoon Tea #1
Hey Everyone! Hope you're enjoying you're time at Clief Notes!
Recently we've had our first Afternoon Tea with Joe Firamonte, founder of Dark Square and Constellation. Joe has spent 2 decades helping billion-dollar companies think through AI strategy before it was a buzzword. His tool Constellation turns mood boards into scalable behavioral data, letting thousands of people respond to imagery in a way that was never measurable before.
This will be a 5 part series of multiple pieces of notes you can take as reference.
As usual, Day 5 will have the biggest drop of value from the webinar!
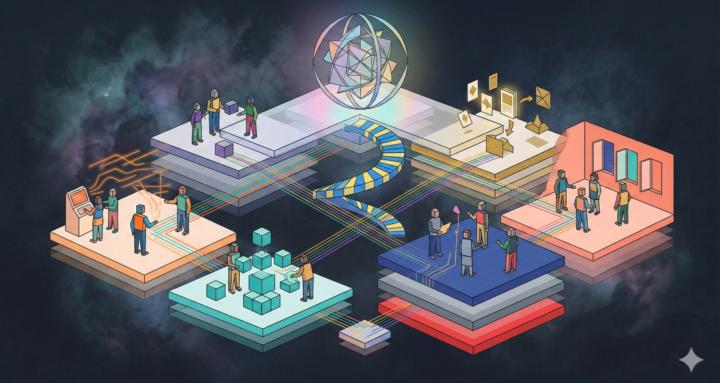
HOW CONSTELLATION SCALES VISUAL DATA
From our webinar with Joe Fioramonti, here's how they solve the visual preference problem:
THE STACK:
INPUT LAYER
- Curated mood boards (6-20 images per board)
- Drag-and-drop interface (green = like, red = dislike)
- URL-based segmentation for demographics
- 2-minute timer tracking decision flow
PROCESSING LAYER
- Heat map generation (preference clustering)
- Time-series analysis (first vs. last choices)
- Correlation filtering ("show me what people who liked X also liked")
- Comparison arrays (liked vs. disliked vs. contested)
ANALYSIS LAYER
- Semiotic discipline frameworks
- AI pattern recognition models
- Threshold-based filtering (risk tolerance)
- Demographic cross-segmentation
OUTPUT LAYER
- Interactive heat map visualizations
- Downloadable data exports
- AI-generated interpretation reports
- Stakeholder-ready presentations
KEY INNOVATION:
Captures preference at the VISUAL level—before language, before rationalization.
Why It Matters:
People recognize meaning before they can articulate it. Traditional surveys miss this.
APPLICATIONS:
✅ Brand identity testing
✅ Retail product preferences
✅ Legal jury selection (!!)
✅ Entertainment creative direction
✅ B2B employee insights
The platform turns subjective design into objective data.
What do you think, does this feel more smooth then most 2 line claude prompts?
3
2 comments
Day 3/5 - Afternoon Tea #1
skool.com/quantum-quill-lyceum-1116
Jake Van Clief, giving you the Cliff notes on the new AI age.
Leaderboard (30-day)
1
+262
2

+175
3

+118
4

+68
5

+61
Powered by