

Oct '25 •
Gold breakdown
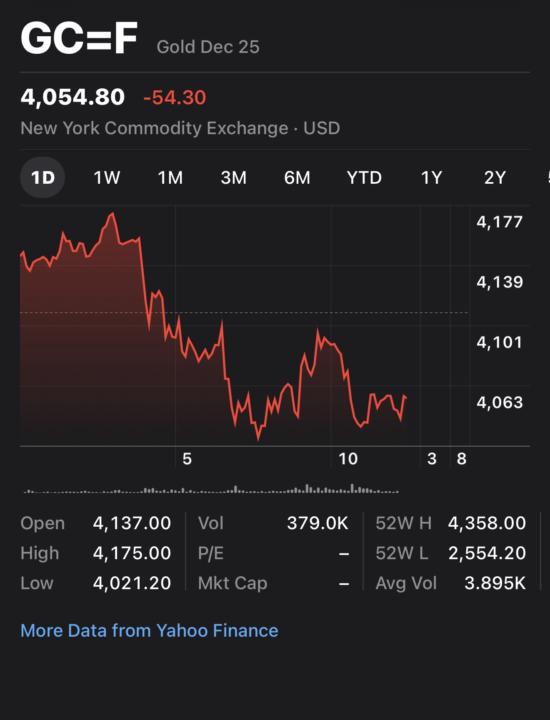
Let’s break down the chart and data shown in your screenshot for Gold Futures (GC=F) — specifically Gold December 2025. 📊 Overview: - Current Price: $4,054.80 - Change: -$54.30 (-1.32%) - Exchange: New York Commodity Exchange (COMEX) - Contract: Gold Dec 2025 - Volume: 379K (relatively active day) - Day Range: $4,021.20 – $4,175.00 - 52-Week Range: $2,554.20 – $4,358.00 🔍 1-Day Chart Breakdown: The 1D (1-day) chart shows a clear intraday downtrend: - Opened at: $4,137 - Early high: $4,175 — the market initially moved up slightly. - Then a steep drop after the early high — indicating strong selling pressure. - Bottomed near $4,021, then small recovery to around $4,060 but no significant bounce, showing weak buyer momentum by the end of the session. Interpretation: This pattern reflects bearish sentiment for the day — likely due to: - Stronger USD or Treasury yields increasing. - Less demand for gold as a safe haven. - Potential profit-taking after recent highs near $4,358. 💡 Spotting a Good Entry (Swing or Short-Term Trade): Here’s how to identify a solid entry point using this kind of chart: 1. Watch for Support Levels: - Short-term support: Around $4,020–$4,050 (today’s low area).→ If the price stabilizes here and forms a higher low, that’s a bullish reversal signal. - Next strong support: Near $3,980–$4,000 (psychological level).→ If price dips to this range but shows volume increasing with slowing downside momentum, that’s a potential entry zone. 2. Confirm with RSI or Momentum Indicators (if available): - Look for RSI below 30 or a MACD crossover upward — both indicate oversold conditions. - Combine with a price bounce from a support level for confirmation. 3. Entry Strategy: - Aggressive entry: Enter near $4,020 with a stop-loss around $3,990. - Conservative entry: Wait for a break above $4,100 with strong volume — confirming trend reversal. - Target: Short-term resistance near $4,175–$4,200.
1
0


1-23 of 23
powered by
skool.com/charted-trading-9397
We make trading simple, interactive, and fun. Learn from other traders, develop your edge, and master the markets all within one supportive community.
Suggested communities
Powered by