Activity
Mon
Wed
Fri
Sun
Aug
Sep
Oct
Nov
Dec
Jan
Feb
Mar
Apr
May
Jun
What is this?
Less
More
Owned by Terrence
We make trading simple, interactive, and fun. Learn from other traders, develop your edge, and master the markets all within one supportive community.
7.12.15 Arts presents: Ink Elite: The Platform for Tattoo Artist to connect with high quality clients:💰 Follow on IG:@ink.elite_ App coming soon!!!
Memberships
Ziggy Tattoo School
648 members • $5/month
Crook's Tattoo Academy (Free)
481 members • Free
Brand Launch (Free)
7.8k members • Free
AI Automation Society
415.3k members • Free
The Vault
27.4k members • Free
Master Realism Drawing (Free)
1.5k members • Free
23 contributions to Charted Trading

Oct '25 •
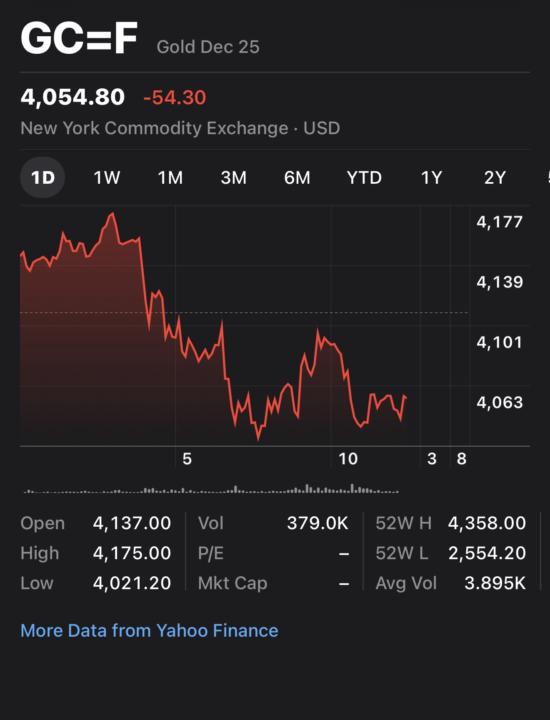
Gold breakdown
Let’s break down the chart and data shown in your screenshot for Gold Futures (GC=F) — specifically Gold December 2025. 📊 Overview: - Current Price: $4,054.80 - Change: -$54.30 (-1.32%) - Exchange: New York Commodity Exchange (COMEX) - Contract: Gold Dec 2025 - Volume: 379K (relatively active day) - Day Range: $4,021.20 – $4,175.00 - 52-Week Range: $2,554.20 – $4,358.00 🔍 1-Day Chart Breakdown: The 1D (1-day) chart shows a clear intraday downtrend: - Opened at: $4,137 - Early high: $4,175 — the market initially moved up slightly. - Then a steep drop after the early high — indicating strong selling pressure. - Bottomed near $4,021, then small recovery to around $4,060 but no significant bounce, showing weak buyer momentum by the end of the session. Interpretation: This pattern reflects bearish sentiment for the day — likely due to: - Stronger USD or Treasury yields increasing. - Less demand for gold as a safe haven. - Potential profit-taking after recent highs near $4,358. 💡 Spotting a Good Entry (Swing or Short-Term Trade): Here’s how to identify a solid entry point using this kind of chart: 1. Watch for Support Levels: - Short-term support: Around $4,020–$4,050 (today’s low area).→ If the price stabilizes here and forms a higher low, that’s a bullish reversal signal. - Next strong support: Near $3,980–$4,000 (psychological level).→ If price dips to this range but shows volume increasing with slowing downside momentum, that’s a potential entry zone. 2. Confirm with RSI or Momentum Indicators (if available): - Look for RSI below 30 or a MACD crossover upward — both indicate oversold conditions. - Combine with a price bounce from a support level for confirmation. 3. Entry Strategy: - Aggressive entry: Enter near $4,020 with a stop-loss around $3,990. - Conservative entry: Wait for a break above $4,100 with strong volume — confirming trend reversal. - Target: Short-term resistance near $4,175–$4,200.
1
0


1-10 of 23

@terrence-fields-9282
I’m a visual artist and trading enthusiast with over 10 years of professional experience. Always looking to learn and help others grow
Active 237d ago
Joined Oct 6, 2025