Activity
Mon
Wed
Fri
Sun
Aug
Sep
Oct
Nov
Dec
Jan
Feb
Mar
Apr
May
Jun
Jul
What is this?
Less
More
Memberships
Blacklist Trading & Investing
128 members • $277/month
Jarvis AI
132 members • Free
6 contributions to Jarvis AI

Jan 22 •
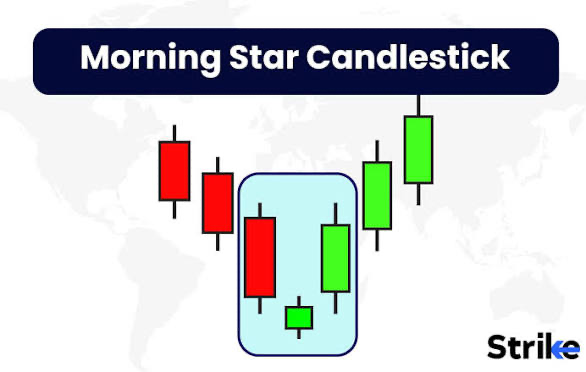
Candlestick Bible Study
A Morning Star pattern is a bullish, three-candlestick formation indicating a potential trend reversal from bearish to bullish, appearing at the bottom of a downtrend. It consists of a large bearish (red) candle, followed by a small-bodied candle (doji or spinning top) showing indecision, and finally a large bullish (green) candle that closes significantly into the first candle, confirming buyers are taking control. This pattern signals sellers are losing power and buyers are gaining momentum, suggesting a potential upward price movement . Characteristics of the Pattern - First Candle: A long, red (bearish) candle showing strong selling pressure. - Second Candle (The Star): A small-bodied candle (like a doji or spinning top) that gaps below the first candle, indicating market indecision and reduced selling momentum. - Third Candle: A long, green (bullish) candle that opens higher (ideally gapping up) and closes well into the body of the first candle, confirming the bullish reversal. How Traders Use It - Bullish Reversal: It's a strong signal that a downtrend may be ending. - Confirmation: While a strong standalone signal, traders often look for confirmation from increased volume or the third candle's strength. - Entry/Exit: Traders might enter long positions after the third candle confirms the reversal and set stop-losses below the pattern.
1 like • Jan 26
@Lemarr Young no problem
1 like • Jan 26
@Edilsa LeGrier no problem
Jan 26 •
candlestick bible study
The shooting star is a bearish reversal candlestick pattern that appears at the top of an uptrend, signaling that prices may soon fall. It features a small real body near the lower end, a long upper shadow (at least twice the body length), and little to no lower shadow. Key Takeaways: - Significance: It indicates that buyers initially pushed prices higher, but sellers took control, forcing the price down, which shows fading bullish momentum. - Appearance: A small body (red is more bearish, but green is possible) at the bottom, with a very long upper wick. - Context: - Confirmation: Traders often wait for the next candle to close below the shooting star to confirm the trend reversal before trading. - Distinction: It is often confused with the inverted hammer, which looks identical but appears at the bottom of a downtrend to signal a bullish reversal. Trading Strategy: - Entry: Sell after the confirmation candle closes lower than the shooting star's body. - Stop-Loss: Place a stop-loss just above the highest point of the long upper shadow. - Resistance: The signal is stronger if it appears near a known resistance level.
5
0

Jan 23 •
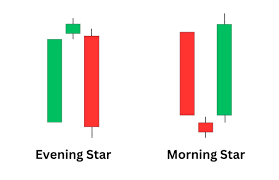
evening star reversal pattern
The Evening Star is a three-candle bearish reversal patternsignaling a potential downtrend after an uptrend, featuring a long bullish candle (day 1), a small indecision candle (day 2, often a dojior small body that gaps up), and a large bearish candle (day 3) that closes deep into the first candle's body, confirming selling pressure. It indicates slowing bullish momentum and a shift to bearish control, often used for short entries or exiting long positions, but requires confirmation from other indicators for reliability. Formation of the Evening Star Pattern 1. First Candle (Bullish): 2. Second Candle (The "Star"): 3. Third Candle (Bearish):
8
0
Jan 21 •
Pre Market Checklist
Pre Market Checklist- you should always have at least your previous day high and lows set on each ticker that you are looking at.This is a easy task that doesn't even require a lot of charting skill to do. the better prepared you are to trade, the better your trading day will be.


Jan 15 •
🔥 JARVIS MULTI-TIMEFRAME A+ SETUPS — RESULTS
🚀 A+ CALL SETUPS (Bullish) 🤖 NVDA — Nvidia 📈 Setup Type: Momentum continuation / leadership 🎯 Breakout: Above 200 🛑 Support / Invalidation: 182 ⏱️ Timeframe: Weekly intraday / short swing 📊 Why A+: • Primary market leader controlling SPX/QQQ sentiment • Strong options liquidity + responsive gamma • Continuation favored as long as structure holds OPTION PLAYBOOK: • 0DTE (index proxy): SPX / QQQ calls if NVDA > 200 • Weekly: 200 or 205 Calls • Bias: Only long above 200 • Risk Line: Below 182 🧠 TSM — Taiwan Semi 📈 Setup Type: Momentum + sector leadership 🎯 Breakout: Above 142 🛑 Support / Invalidation: 134 ⏱️ Timeframe: Weekly intraday / short swing 📊 Why A+: • Semiconductor demand strength + AI supply chain exposure • Cleaner swing structure than intraday chop • Strong follow-through once highs break OPTION PLAYBOOK: • Weekly: 145 Calls • Bias: Break & hold above 142 • Risk Line: Loss of 134 🧠 AMD — Advanced Micro Devices 📈 Setup Type: Momentum continuation 🎯 Breakout: Above 172 🛑 Support / Invalidation: 162 ⏱️ Timeframe: Weekly intraday 📊 Why A+: • Strong sympathy with NVDA/AI theme • High volume, liquid weekly options • Expansion likely on reclaim of highs OPTION PLAYBOOK: • Weekly: 170 or 175 Calls • Bias: Only above 172 • Risk Line: Below 162 🛡️ LMT — Lockheed Martin 📈 Setup Type: News-driven rotation 🎯 Breakout: Above 530 🛑 Support / Invalidation: 500 ⏱️ Timeframe: Weekly intraday / short swing 📊 Why A+: • Defense rotation supported by geopolitics • Institutional bid, low headline noise • Smooth trend continuation potential OPTION PLAYBOOK: • Weekly: 540 Calls • Bias: Hold above 530 • Risk Line: Below 500 ⚙️ SMCI — Super Micro Computer 📈 Setup Type: Momentum resurgence 🎯 Breakout: Above 345 🛑 Support / Invalidation: 315 ⏱️ Timeframe: Weekly intraday 📊 Why A+: • AI infrastructure exposure • Volatile but clean continuation above highs • Excellent weekly option movement OPTION PLAYBOOK: • Weekly: 350 Calls • Bias: Above 345 only • Risk Line: Below 315
0 likes • Jan 15
@Chris Lee some of your levels are a little off
1-6 of 6

Active 4d ago
Joined Nov 9, 2025
Powered by