Activity
Mon
Wed
Fri
Sun
Mar
Apr
May
Jun
Jul
Aug
Sep
Oct
Nov
Dec
Jan
Feb
What is this?
Less
More
Memberships
Learn Microsoft Fabric
15.3k members • Free
5 contributions to Learn Microsoft Fabric

13d •
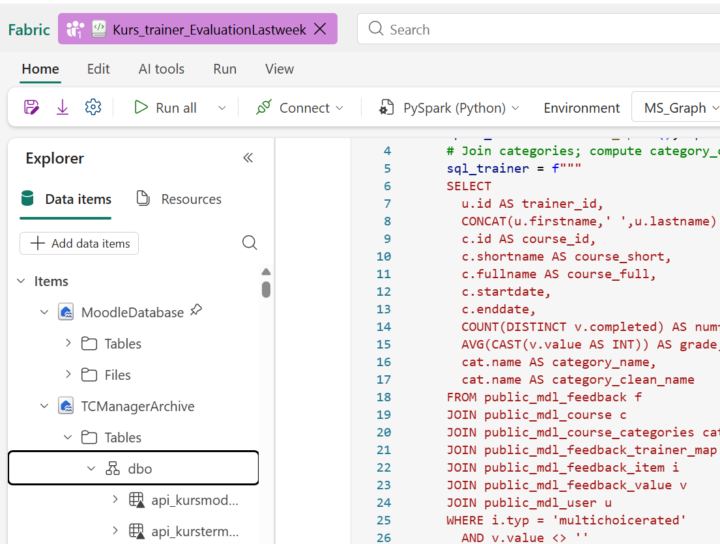
Read tables from a second Lakehouse in the same Fabric notebook
I am working in Microsoft Fabric and need to use two Lakehouses in the same notebook (later inner join between 2 tables from 2 lakehouse or join using 2 dataframes). I can read data from the default Lakehouse (for example: df_mean = spark.sql(sql_trainer)), but I cannot read tables from a second Lakehouse that is not set as default. What is the correct way to read tables from the second Lakehouse?
0 likes • 10d
@Sneha J Thank you Sneha ! but in this case, I should transform the table to pyspark dataframe and I won t be able to write SQL query joining between the 2 lakehouses ?
2 likes • 10d
@Sneha J it works like htis thanks a lot 🙂
Sep '25 •
Automating email-based reporting with Fabric and Microsoft Graph
Hi, I’m working on a project where colleagues can send an email to a bot address. When the bot email receives a message (based on the subject line), it should: 1. Retrieve data from the lakehouse. 2. Generate a report or dataset as an Excel file. 3. Reply to the original email with the report attached using Microsoft Graph. 4. Additionally, send scheduled weekly reports to specific recipients. My idea is to implement this in Fabric using a notebook, running every 15 minutes to check for new emails, query the data via GraphQL in Fabric, and then send the results. My questions are: - Is this approach feasible in Fabric notebooks? - Regarding GraphQL authentication: when I run it locally, it opens a browser for login. Is it possible to use a token instead, and if so, how should I configure it so that it works automatically in Fabric? thank youu
Sep '25 •
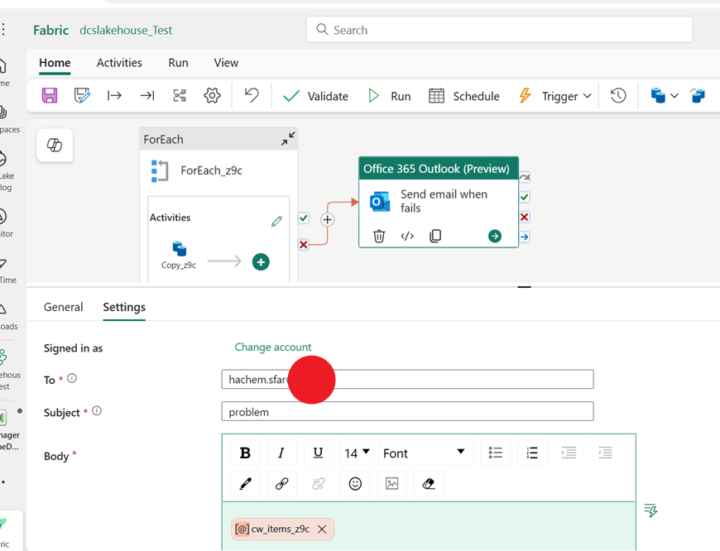
How to send detailed notification when Fabric pipelines fail?
I have multiple pipelines in Fabric. Some copy databases (like PostgreSQL) into the warehouse, while others run notebooks and collect data from APIs and Firebase into Fabric. Right now, I only receive a simple email notifying me that something went wrong, but I need to open the pipeline manually to check the error details. What I want is: - To automatically send an email with the log file or detailed error message when a pipeline fails. - To send this email in HTML format so it’s easier to read. How can I configure this in Fabric? Is there a built-in way ? Any guidance would be greatly appreciated!
Jul '25 •
Can’t create measures or see views in report from Fabric Lakehouse
Hi all, I’m building a Power BI dashboard in Microsoft Fabric using a Lakehouse as the source. When I click "Create report" from the Lakehouse, I can only see the tables, not the views I’ve created. Also, I’m unable to create new measures or calculated columns within the report. My goal is to build visualizations based on views, not just raw tables. Is there a way to enable views in the Lakehouse UI or make them accessible in Power BI for reporting? Also, is it expected that measure creation is disabled in this context? Appreciate any help or clarification. Thank you!
0 likes • Jul '25
Thank you for the response. Regarding access, I’m the admin of the Fabric instance, so I believe I have the necessary permissions — but please let me know if there's something specific I should check. As for the semantic model, I imported data from a PostgreSQL database into Fabric. However, relationships between the tables were not created automatically(only data was copied not the relationships), and with over 1,100 tables, it's not feasible to define them manually. Is there a way to automate or simplify this process? Also, when I try to analyze views (created from these tables) in Power BI, only the raw tables appear — the views are not visible. Is there a way to make views accessible for reporting?
Jul '25 •
Fabric pipeline copy data from PostgreSQL to warehouse doesn’t preserve relationships (PKs/FKs)
Hello everyone, I'm new to Microsoft Fabric and currently working on data pipelines that copy data from a PostgreSQL database to a Fabric warehouse. The data copies successfully, but I noticed that primary keys and foreign key relationships are not transferred to the warehouse tables. All the tables are created, but the relationships between them are missing. (over 550 tables) Is this the expected behavior? Is there a way to preserve or automatically recreate the primary/foreign keys during or after the pipeline execution? Any advice or best practices would be appreciated. Thanks!
1-5 of 5