Activity
Mon
Wed
Fri
Sun
Apr
May
Jun
Jul
Aug
Sep
Oct
Nov
Dec
Jan
Feb
Mar
What is this?
Less
More
Owned by Douglas
Community of entrepreneurs and innovators adding AI Business Automations, Blueprints and Strategies to their businesses.
Memberships
Kill Your Bad Ideas (KYBI)
74 members • Free
AI Agents Academy
687 members • Free
7 contributions to Bitcoin

Jun '25 •
Bitcoin is the most important thing happening according to Treasury Secretary
https://x.com/vivek4real_/status/1935409674108760507?s=46&t=iEj2-HQHm-jWzqZp7CuxcA


0 likes • Jun '25
Bitcoin now - and the cryptos with ETF releases this year - will be the big winners for early players.
Jun '25 •
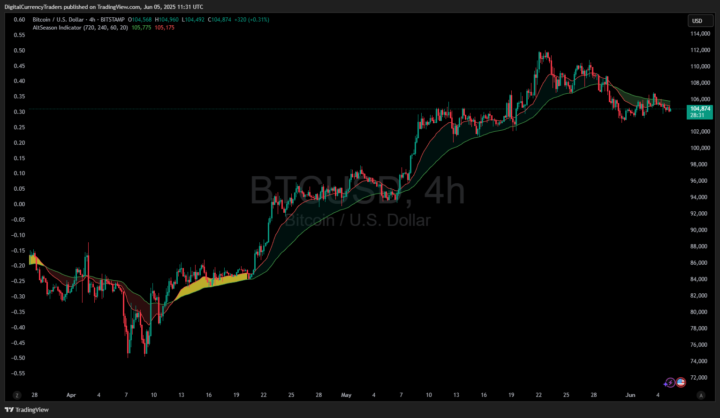
Bitcoin’s Next 4-Day Shockwave: Are You Ready for the $110K Pop?
I’m staring at the 4-hour BTC/USD chart, and it’s flashing “calm-before-the-storm.” After a textbook V-reversal in early April, price hugged that emerald 60-period EMA like a magnet, stair-stepping all the way to a euphoric peak near $112 K in mid-May. Since then we’ve been gliding sideways—volume cooled, volatility bottled, sentiment yawning. That lull never lasts. - Trend Structure: Higher highs, higher lows remain intact—bulls still own the sandbox. - Dynamic Support: The green ribbon (20/60 EMA cloud) keeps catching every dip; buyers defend the ~$102 K zone with military precision. - Momentum Coil: RSI (not pictured) has reset from overbought to neutral while price refused to break trend—classic “energy reload.” - Measured Move Math: Break above $106 K projects a symmetrical leg right back toward $112 K-$114 K—then blue sky. Feel the tension? Each 4-hour candle tightens the spring. When that red fast EMA slices up through price once more, history says the move erupts within 16-24 hours—often before most traders finish their coffee. What This Means for You - Front-run the breakout with a tight stop beneath $101 K. - Ladder exits around previous high, leave a moon-bag for $120 K+. - Prefer risk-off? Wait for the first retest of $106 K as newfound support—confirmation is profit insurance. I’ve laid the breadcrumbs; the next step is yours.

🔥
Oct '23 •
Disclaimer: This community does NOT provide financial advice.
Nobody knows if the price is going up or down, so don't ask. And always speak to a financial advisor for professional investing advice. But the way I see it, the more bitcoin I get now, the richer I'll be in the future. Is it guaranteed? Of course not. But is it possible? Sure is. I predict by the year 2035, the price of Bitcoin will be (at least) 1 million dollars per coin (and that's being conservative.) But to make sure YOU are able get bitcoin at the best price, and to make sure YOU store it securely... And you need to understand how bitcoin works. And this community will help you do just that! So welcome :)

0 likes • Feb '24
@Paul Cerone be sure to check out Ted's tutorial on hardware wallets: https://www.skool.com/bitcoin/classroom/a974ac32?md=ab908a382c994af6bba04d93340a6431
Feb '24 •
Bitcoin Price Predictions
I love the collection of videos you have in the Price Prediction part of your course: https://www.skool.com/bitcoin/classroom/2cbd686c?md=e7797c2a13a04841be417a3049c4ea18 Keeps a guy addicted to watching!
2
0

Jan '24 •
Bitcoin price drop
Hi thoughts on why bitcoin price has dropped, I was expecting it to go up after the etf approval?
0 likes • Jan '24
never enough to know why - you have to know your trading plan in advance of a top formation like we just saw.
1-7 of 7
@douglas-lampi-2222
You're Not Just In-The-Know about Artificial Intelligence, You're In The 'Know How'
Active 46d ago
Joined Jan 31, 2024
ENTJ
Canada
Powered by