Activity
Mon
Wed
Fri
Sun
May
Jun
Jul
Aug
Sep
Oct
Nov
Dec
Jan
Feb
Mar
Apr
What is this?
Less
More
Memberships
OptionProfits
544 members • Free
Trading Growth Engine
775 members • Free
1339 contributions to Trading Growth Engine

16d •
$11k on ES 🤪
@Michael Traner crushed on ES a couple days ago during our live calls 🔥 Trading futures with option data is a cheat code 🤫

0 likes • 16d
what futures /mes ?
16d •
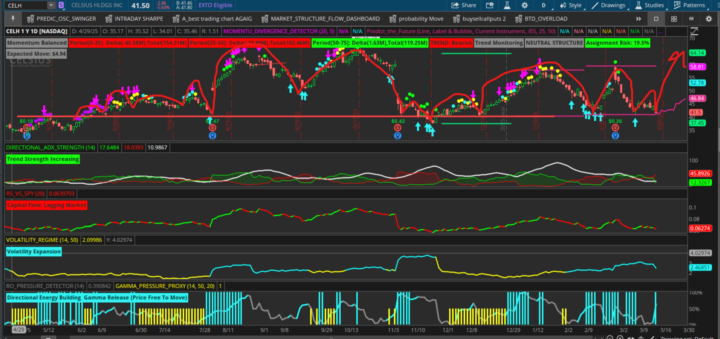
CELH
Celsius Holdings stock is under pressure this week as Wall Street weighs whether Costco Wholesale's decision to launch an inexpensive energy drink could negatively impact demand for Celsius products. As of Thursday's close, Celsius stock is down in five straight sessions, losing about 17% over that period. The steep decline comes amid Costco releasing a line of energy drinks under its private label Kirkland Signature -- with similar flavors and packaging that bears a striking resemblance to Celsius products, but at a 55% discount. Costco also happens to be a major distributor for Celsius energy drinks, with the retailer accounting for about 11% of Celsius' total revenue last year. "We're aware of the launch, and it does not change our conviction in the broader Celsius growth story, our execution priorities, or our long-term strategy," a Celsius spokesperson told Barron's Thursday. The spokesperson added that "a value-priced private-label launch can get trial, but it is too early to conclude that trial becomes durable switching in a highly brand-led energy category." Celsius stock was in positive territory for parts of Thursday, but ended the day down 0.9% to $35.59. The stock is also now down 33.6% in March, and is on pace for its worst monthly performance since January 2022, when it sank 36%, according to Dow Jones Market Data. "While the introduction by a major customer of a competing product is not a good development, we believe the dramatic drop in the share price is overdone," analysts at Roth Capital Partners wrote Thursday. The firm noted the Costco appears to be limiting the launch to "certain markets" and that Kirkland Signature products are only available at Costco. Roth has a Buy rating on Celsius with a $67 price target. A team of TD Cowen analysts led by Robert Moskow broadly concurred with this view on Wednesday. TD Cowen also has a Buy rating on Celsius along with a price target of $66. "The sell-off looks like an overreaction," the analysts wrote. "We view the pullback as a buying opportunity given strong distribution tailwinds in 2026."
0 likes • 16d
@Manj Dona that and MNST
0 likes • 16d
@Manj Dona Big Picture (Daily Chart) Current State: Trend: Bearish PPO: Below signal → bearish pressure Momentum: Weakening / not confirming upside TMO Engine: Mixed → not clean reversal My system literally says: TRADE REGIME: Bearish Setup STRUCTURE + FLOW (Your Edge) Dealer / Gamma Context (VERY IMPORTANT) From my gamma chart: Gamma Flip: ~259 Call Wall: ~260 Put Wall: ~220 Price: ~234 the Interpretation: ADBE is BELOW gamma flip in NEGATIVE GAMMA This means: Market is not stabilized Moves can expand (trend continuation likely) Dealers are NOT damping volatility Translation: Environment = TREND / EXPANSION (NOT mean reversion) My SYSTEM SIGNALS (THIS IS KEY) From the dashboards: 1. TMO Engine Momentum = weak / fading “OPTION SELLING ENVIRONMENT” showing up, BUT… !!!!!This is in a downtrend context 2. Predictive Oscillator Mostly: CHoCH (failed) BOS (downside) No sustained bullish structure This = failed transitions means continuation lower 3. AlphaFusion / ROC Negative projection HTF trend = DOWN This confirms No higher timeframe support yet LOWER TIMEFRAME (10m / 1h) What you’re seeing: Repeated CALL SELL signals Weak bounces Lower highs forming This is classic: Distribution and continuation setup KEY LEVEL MAP (THIS IS WHAT MATTERS) Resistance Zone 245–260 (gamma flip + call wall) Hard ceiling unless structure changes Current Zone (~234) Weak / no support confirmation Sitting in air pocket Support 220 (put wall) First real stabilization zone TRADE ENVIRONMENT CLASSIFICATION (YOUR SYSTEM) Factor Read Trend Bearish Gamma Negative Momentum Weak Structure Lower highs Flow Distribution FINAL ENVIRONMENT: BEARISH TREND CONTINUATION PLAYBOOK (BASED ON MY FRAMEWORK) ❌ NOT IDEAL FOR: Long calls Aggressive dip buying FAVORABLE FOR: 1. Covered Calls Weak trend + capped upside 2. Call Credit Spreads Fade rallies into resistance (240–250+) 3. Wait for THIS to go long: You need: 1. Price > 259 (gamma flip)
28d •
Do you think SPY will recover this week or go lower?
I'll post the analysis I shared with my in the comments below later. Show me your SPY analysis!
Poll
6 members have voted
0 likes • 27d
@Ruben Leija like walking up on a covey of quail, everybody flies off in different directions going up - just don't know which one to shoot lol
0 likes • 27d
@Ruben Leija big call and put OI at 6700 could either get pinned here or we play the dip. Still early in the week would like for it to test 6750
1-10 of 1,339

@charles-antonini-9531
trading for some time but mainly selling options for income
Active 13h ago
Joined Sep 23, 2024
Powered by