
Write something

May 14 •
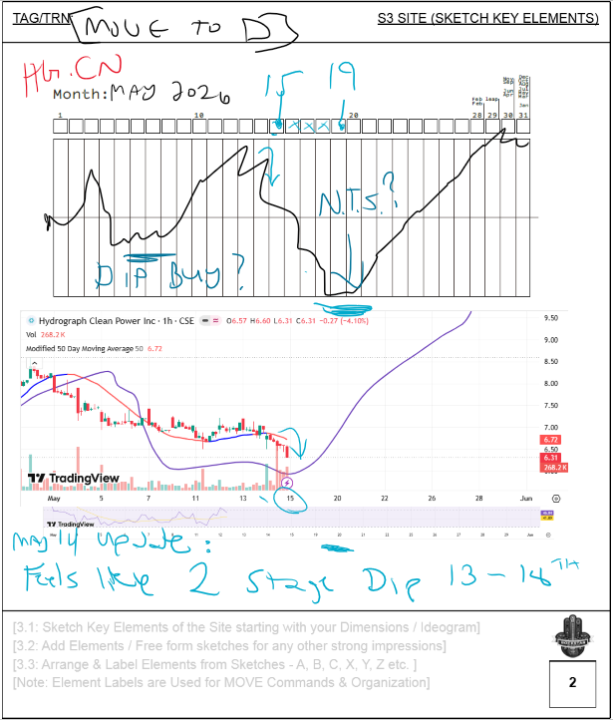
May 2026 - Hydrograph Session Update (Big Move Coming?)
I've been watching for a mid-May dip in Hydrograph since early 2026 when I ran a yearly session and it dropped almost 10% today - This chart was posted in the VIP section on April 25th or so (lighter blue writing added today). This month's chart is lining up reasonably well and we may see a nice reversal soon. I think the ideogram was telling me we've got a 2 stage dip bottoming out between May 13-18 or so and potentially moving up from there - significantly perhaps. The purple line on the feedback chart is a cowboy session I ran right in trading view at a much longer scale (July 2025 to July 2026), so the moves are a bit simplified/exaggerated but both seem very similar - I seem to have caught the vibe of this months price movements and timing. For anyone who hasn't seen my video about this stock before I will drop a link in the comments. There is a members version in the VIP section which includes the longer charts (July 2025 - July 2026 & 2026 annual). I'm not sure how high it's going but I expect it will end the year strong, I bought some dips today and will probably buy more if it goes lower, while continuing to monitor and adjust as the price moves month to month. As always, I am not telling anyone to buy anything here - Do your own research - but remote viewing data from multiple viewers and sessions suggests this stock will be moving up soon and we may be at a solid buying opportunity. I will have mid-month updates for all charts posted in VIP by Sunday at latest - I might try doing it as a video this month.
1
0
May 1 •
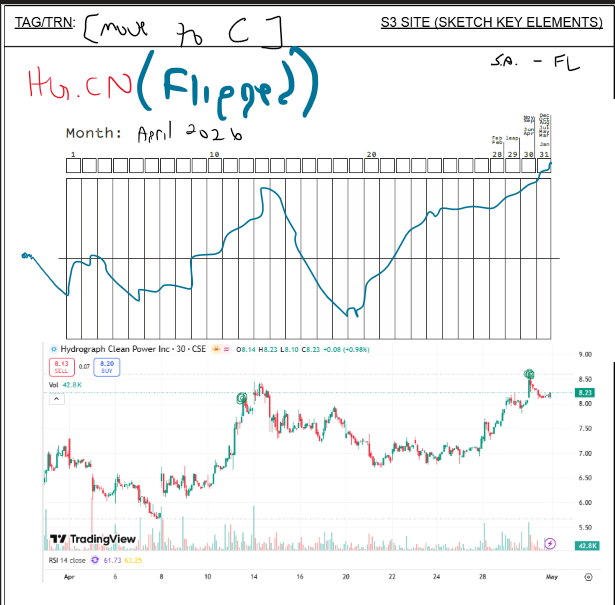
Hydrograph Hit - April 2026
This was one of the tightest correlations I've had - profit targets hit at the green circles - May predictions are now posted in the VIP section!
3
0
Mar 18 •
How I used Remote Viewing to Screen this "Unicorn" Stock
I'm SUPER excited to share this video case study, which documents the remote viewing methods I've used to manage my investments since April 2025 and realize 200%+ gains! Much of this success comes from one stock (along with Silver/Uranium) - Back in July 2025, I began running a long-term project screening a particular clean energy company called Hydrograph using multiple remote viewing approaches - I am up about 400% so far on this stock and I explain my process in depth in this video. I've also been running similar sessions on a number of other assets on a monthly basis and posting them under the new "VIP" Tier of the Rock Star Intuition Skool - VIP's get access to all of the RSI courses as well as my financial RV sessions and analysis (not financial/investment advice) at the beginning of the month, plus updates as the month progresses and the data begins to line up. I've also added a Student Tier (Premium) at half the price for anyone who just wants an affordable option to learn RV, without the monthly financial predictions. I do still plan to keep releasing free content with Second House RV each month and providing updates to all RSI members on those sessions too. Huge thank you to everyone who continues to support this work!
Apr 11 •
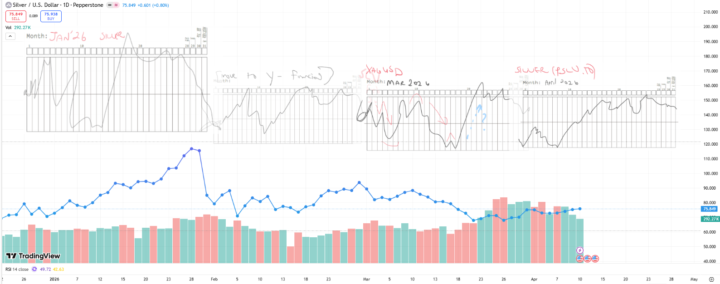
4 Months of Silver Remote Viewing
My last 4 months of silver remote viewing predictions scaled into Tradingview - caught a lot of nice moves - I think the March chart was less literal and more symbolic, telling me "buy the late March dip and strap in for longer term gains" - looking good for April so far. I've been buying any time it dips below $70 and taking profits above/around 90 (got stopped out at end of January somewhere north of $105 in the parabolic volatility too) I'm a pretty risk avoidant person generally speaking and I'm not working with big account size here but I've locked in about $1800 in profits from this experiment, or nearly $500 a month in gains added to my savings on average - slow and steady wins the race. If you want to stay on top of all my financial chart predictions, I drop them in the Classroom every month for VIP subscribers (with updates during the month to stay on track too) - I don't day trade - the purpose of these sessions is to find the best buying and selling points in any given month.
Apr 6 •
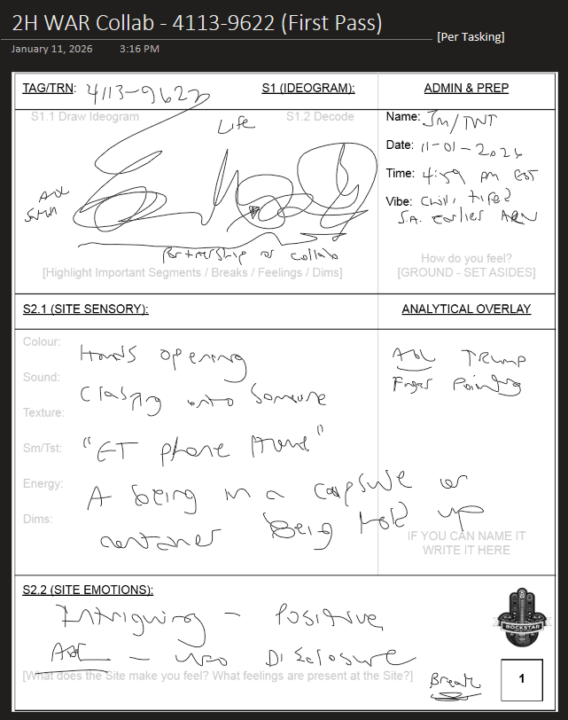
World Astrology Report Target - Partial Feedback
A bunch of people said in the video comments they thought some of us were getting aspects of the NASA mission and we realized that ourselves back on April 1 when the mission launched - I did this session on January 11th - I think I also got aspects of the shuttle returning to earth but those pages haven't hit yet - also solved my spirit in the sky AOL - Logged in to listen just a moment before the crew was going dark and they were reading a bible quote about the nature of love - wild stuff.
1-11 of 11
powered by

skool.com/rock-star-intuition-6794
Monthly News & Market Predictions ||| Strength Training for the Soul
Explore the Intuitive Art & Science of Remote Viewing with Rock Star Intuition
Suggested communities
Powered by