
Write something

7d •
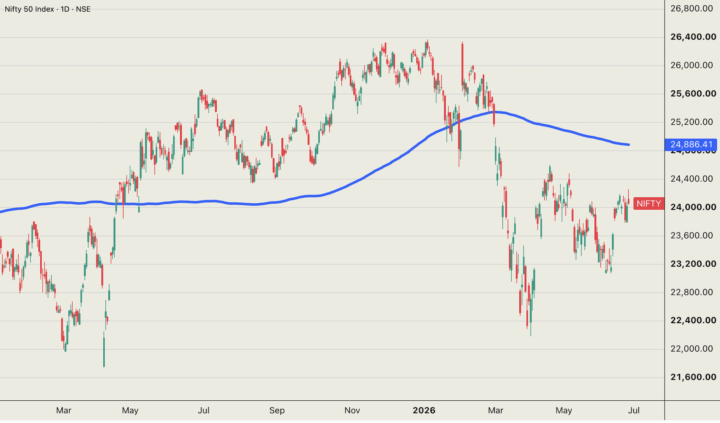
I've Been Watching India for Months. I'm Finally In (Small Account-Friendly)
I've been watching India for months. India is currently the world's fastest-growing major economy: 7.7% real GDP growth last fiscal year, inflation at 3.4-3.9% inside the RBI's 2-6% target, and a domestic equity market that has become one of the most watched in emerging markets over the past years. For US options traders, the cleanest way to access it is INDA, iShares' USD-denominated ETF tracking India’s large-cap equity market. Think HDFC Bank, Reliance Industries, Infosys, ICICI Bank. The domestic consumption and financial franchise story, packaged into something a US brokerage account can touch and trade options on. INDA peaked at $58.53 last year. It's now sitting at $49.55, a 17.82% drawdown, near its 12-month low of $48.10. The economy didn't slow down to cause that. That gap between price action and fundamentals is my trade. That divergence is what I've been watching. Here's what I found. An 18% drawdown at 14% realized volatility INDA fell from $58.53 to $48.10 over the past year at an annualized 30-day realized volatility of approximately 14% (!). That number tells you something specific about how this market moves. It's a grinding multiple compression that played out over months, driven by foreign institutional investors rotating out toward cheaper Asian peers as India's premium vs. the region became harder to justify. The Nifty rerated from well above its 5-year trailing P/E average down to roughly 22.7x, below that 5-year average of 24.5x. The economy kept growing, but the multiple compressed. India has been falling slowly enough that every step has been manageable. The fear on the surface is not episodic Front-month IV sits at 16-18% against that 14% realized volatility. IVR at 37. A modest spread. Put demand on INDA doesn't build around events; it builds around risks that never fully clear. India’s equity premium vs. regional peers can compress without any fundamental catalyst. FPI outflows can accelerate on relative-value decisions that have nothing to do with Indian GDP. The rupee has been on a persistent multi-year depreciation in USD terms. None of these risks expire with the option. They reload every cycle.
3
0
11d •
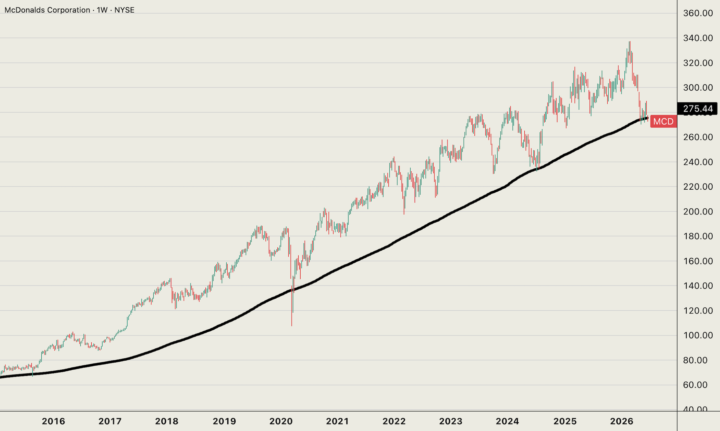
Collecting Premium on a World-Class Franchise Sitting Below Every Moving Average
There's a pattern I keep coming back to: great businesses occasionally fall below key moving averages, and not because something is broken at the core. Because the tape gets ugly, sentiment drifts, and everyone sells. Then the business keeps compounding and the chart eventually reverses. Today that name is McDonald's. MCD is pressing against its 52-week low, trading near $271. It's down roughly 20% from the $342 high earlier this year. The 50-day moving average is in the $279-289 range. The 200-day is at $303-306. The stock is below all of them, death cross confirmed, MACD below signal. This is a business with roughly 40,000 locations worldwide generating approximately $7 billion in free cash flow annually. A dividend that has grown for decades. The kind of franchise model that collects royalties through every recession, rate cycle, and consumer panic on record. The chart says sell. In my view, the business says this is temporary. Distortion 1: The options market isn't pricing crash 30-day implied volatility is running around 16.5%. 10-day realized volatility is near 21%. There's a modest volatility risk premium in the front of the curve, but it's not extreme. Short-dated options are pricing 2-4 week moves of roughly 3-4%. Puts priced slightly above calls on a relative basis, but not at panic levels. In the very front of the curve, call IV has actually been running above put IV, which tells you the dominant flow is overwriters and credit call strategies, not one-sided put buyers bracing for a structural breakdown. The market thinks MCD grinds from here, and that ambivalence is where premium sellers find their entry. Distortion 2: The crowd is leaning the wrong way Options volume has been running 70% above normal in MCD recently, and almost all of that flow is credit call strategies: traders selling call spreads betting the stock won't reclaim resistance anytime soon. That's a directional positioning bet that MCD stays down. Meanwhile, dealer gamma sits near flat just above $280. If MCD pushes back toward $287-290, hedging flows flip from dampening to amplifying. The crowded short-call overhang becomes forced-covering fuel, and any bounce into that area turns reflexive fast.
1
0
11d •
The "linear" theta line is a lie
I ran every strike through Black-Scholes this weekend. The output surprised me ($100 underlying, 20% IV, 4% rates): - ATM theta at 30 DTE: $4.36/day per contract - ATM theta at 1 DTE: $21.43/day per contract ATM decay accelerates into expiration. But OTM does the opposite. 5% OTM theta peaks at 21 DTE, then collapses, 10% OTM theta is essentially gone by 14 DTE. The closer you get to expiration, the slower OTM premium decays. The reason is gamma. Theta doesn't have its own engine. It borrows gamma's. Near expiration, gamma concentrates almost entirely at the money. OTM strikes lose gamma, so they lose theta too. Your OTM short that feels safe at 21 DTE has already peaked. Holding it to expiration isn't collecting more decay. It's carrying pennies in front of a steamroller. Theta is not magic income. It is rent for sitting on gamma risk.
1
0

14d •
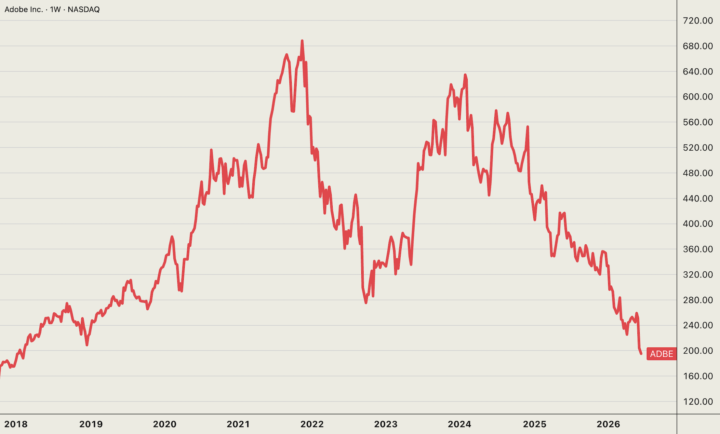
Adobe just fell to its lowest price in more than 8 years
ADBE is now down more than 70% from its 2021 peak. So if you bought and held one of the "safest" software names in the market, you're sitting on one of the ugliest drawdowns in mega-cap tech. But as a premium seller, this is exactly where the opportunity starts. This is where I look for asymmetric structures. My famous put ratio is one example. Stack enough credit into high IV and the premium pulls your EFFECTIVE COST BASIS TOWARD ZERO. The stock can keep falling, but you don't need to own it blindly. This is why we sell volatility instead of holding the stock. More specific trade ideas on ADBE coming soon.
23d •
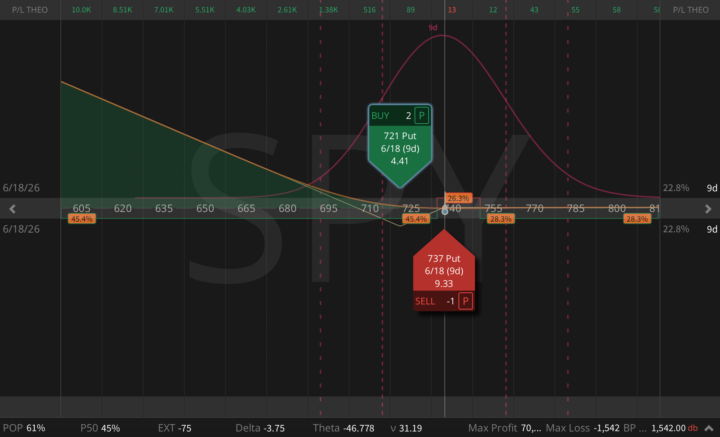
Emergency Note: How to Recover Buying Power Fast (3 Proven Techniques)
The AI derating that started Friday came back for another round today. Nasdaq down 2.2%, Semiconductor index down nearly 6%, Broadcom off more than 4%, Nvidia almost 3%. The S&P tech sector hit its lowest level in over a month following a 4.4% slide. And then, mid-session, Trump announced that Iran had shot down a U.S. Army Apache helicopter and vowed that "the United States must respond." For about 90 minutes, it looked like March all over again. Except crude oil, the actual leading indicator for war risk, closed down roughly 3%. The fundamentals said something else entirely. Net-net, today's selloff was still an AI/valuation unwind and higher-for-longer Fed anxiety following Friday's hot jobs report. In my view, the geopolitical tape added noise; it didn't change the thesis. But your margin system doesn't care about the thesis; it saw VIX spike 15% to the 23 range, watched your short puts expand, tracked your beta-weighted delta drifting long across the portfolio, and started projecting losses. This is the moment where bad decisions compound. Here's how we handle it. 1. The Zero-Cost Trump Crash Hedge (9 DTE) This is a put back ratio built specifically for today's risk window; an active geopolitical backdrop, CPI tomorrow, a record-size SpaceX IPO later this week, and a still-crowded AI/mega-cap positioning environment. Entering this position pays you $58. In a long-delta portfolio, it also releases buying power rather than consuming it, reducing your overall risk profile in the eyes of the margin system. The standard put ratio (buy one, sell two lower) leaves you net short below the lower strike. A real crash destroys it. This is the put back ratio: sell one higher, buy two lower. The worse things get below 737, the more this position pays, at an accelerating rate. Completely different animal. What the P&L diagram won't show you: the two long 721 puts carry significant volga and vanna. In a real crash, where volatility spikes and SPY falls simultaneously, vega itself accelerates and delta compounds faster than gamma alone suggests. All five Greeks move in your favor at once. At 9 DTE, gamma is the dominant Greek. If SPY breaks through 721, this position moves close to dollar-for-dollar with the market immediately.
1
0
1-30 of 44
powered by

skool.com/options-jive-1159
STOP trading market direction. Start using options strategies to turn volatility into steady income. We sell premium, and think in probabilities.
Suggested communities
Powered by