
Write something

May 25 •
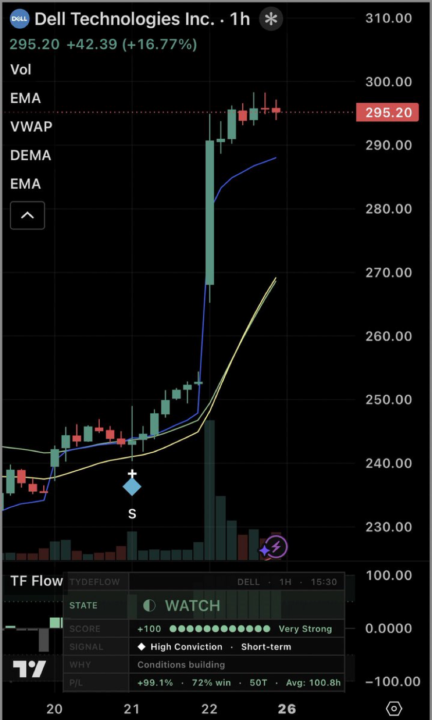
$DELL — seems institutional footprints showed up before the news did.
On 5/21, TydeflowPRO prints a High Conviction signal on the 1H chart — while DELL still grinding quietly in the $235–250 range. Nothing dramatic on the surface. Next session, DELL gaps up, runs 20%+ on earnings. To be very clear: the indicator didn’t "predict earnings." Nothing can. But what it did find was the footprint underneath—the volume and positioning patterns consistent with institutional accumulation ahead of an important catalyst. One example is just one example, not a track record. But this is the kind of footprint the system is built to find. Analysis, not a recommendation. Do your own work. Tydeflow PRO — tydeflow.app
0
0
May 13 •
tydeflow.app is now up!
If you’d like to try out Tydeflow PRO go to tydeflow.app and sign up.
0
0
May 11 •
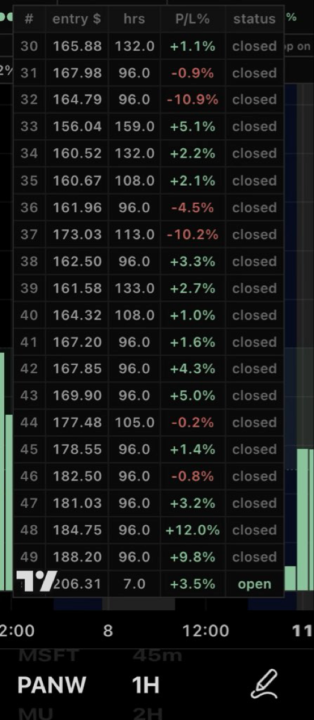
Backtesting is Built into Tydeflow 🔦
Your backtesting is built into the Tydeflow indicator. Now you can see prior trades made by the algorithm, how long the stock was held, win rate, and the trade’s P/L. Try out the beta: https://www.tradingview.com/script/1mU3dPBY-Tydeflow-PRO-The-Institutional-Footprint-Scoring-Indicator/
0
0
1-9 of 9
powered by
skool.com/kingdom-traders-4443
Tydeflow PRO indicator access + daily setups + weekly reviews + educational content. Built for serious swing and position traders. FREE to join!
Suggested communities
Powered by