
Write something

Feb 2 •
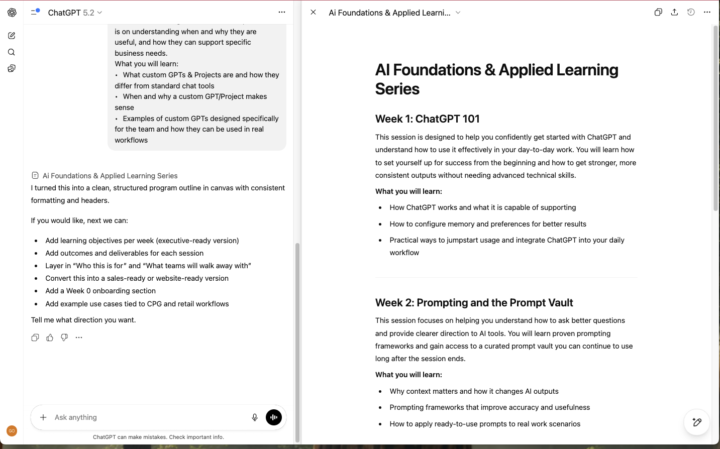
Canvas Mode
I might be late to the party… but Canvas Mode is way more than just coding 🤯🛠️ For the longest time, I had Canvas Mode mentally filed under “for engineers only.” Turns out, that’s outdated thinking. Canvas has quietly evolved into one of the best ways to write long-form documents inside ChatGPT—with a Notion- or Google Docs–style workflow. What makes Canvas powerful: ⚡You get a split view: - Chat on the left (where you prompt, refine, and ask questions) - Your live document on the right (where changes happen instantly) You can: - Ask ChatGPT to expand or rewrite a specific paragraph - Search within the document - Change tone, structure, or formatting without copy/pasting - Iterate continuously without losing context THREE high-impact docs CPG founders should try in Canvas Mode: 📄📦 1. SOPs & internal playbooksDraft once, then ask ChatGPT to tighten steps, add edge cases, or simplify language for ops teams. 2. Recipes / formulations / spec docsIterate on clarity, scale-up notes, allergen callouts, or versioning—without juggling multiple tools. 3. Quarterly updates or board memosStart rough, then refine the narrative, sharpen KPIs, and pressure-test clarity before sharing. Pro tip: Use Canvas when the document will take 10+ minutes to think through. Regular chat is great for ideas; Canvas is where things get finished. 👉 Try one doc in Canvas this week and share what you built in #wins 🏆📝
0
0
Dec '25 •
Product Innovation
Ever wanted to test a new product idea without the full development process. Give this prompt a spin the next time you have an idea that you want to bring to market. Product Innovation Prompt Context: I’m a CPG founder validating a new product concept before investing in production. Role: Act as a CPG innovation and concept-testing expert. Intent: Stress-test the concept for desirability, clarity, and differentiation. Task: “Assess the concept’s value proposition, claims, and reason-to-believe” “Identify potential consumer confusion or resistance” “Recommend refinements to improve appeal and purchase intent” Output: A concept evaluation with clear strengths, risks, and optimization suggestions. Product Idea: [Describe your product idea with as much detail as possible] SAMPLE OUTPUT: Creatine Gummy for Women https://chatgpt.com/share/69505506-dcb4-800a-b285-7c94fcfaecba
0
0
Dec '25 •
Email Prioritization
Premium AI is included in Google Workspace, built into popular apps like Gmail, Docs, Sheets, Meet, and more. Here a prompt to get you started. 🤖PROMPT: I am overwhelmed with not knowing where to start with emails I need to answer. What looks to be the most urgent in the last 5 days? Focus on anything client related. FOLLOW-UP PROMPT: Let's prioritize the 10 emails I need to answer first. TBH it did great with the first prompt but only identified 2 emails and just okay with the follow-up. 👉Give it a try and let me know what you think!
0
0
Dec '25 •
ChatGPT Connectors
Why connectors in ChatGPT are a game-changer (and how to set them up) 🤖⚡ TL;DR: Connectors let ChatGPT securely access your real tools (Drive, Slack, Notion, CRMs, etc.) so you can stop copy-pasting and start working with live business data. Why this matters for CPG teams: - ⏱️ Save time: No more exporting files or pasting context - 📊 More accurate outputs: Uses your actual numbers, SKUs, and docs - 🔁 Repeatable workflows: Weekly reports, summaries, follow-ups - 🤝 Team consistency: One source of truth across ops, sales, marketing How to connect (5 steps): 1. Open ChatGPT → Profile →Settings → Apps & Connectors 2. Choose a tool (Google Drive, Slack, Notion, etc.) 3. Authenticate + approve permissions 🔐 4. Confirm the connection (you can remove access anytime) 5. Reference it in plain English:“Summarize the doc called ‘Retail Pitch v3’” Pro tip: Start with read-only access and always review outputs before sharing externally. 🎥 Watch the walkthrough: https://www.loom.com/share/af605bbada124376bf9baaad1427098b?t=48 👉 Try connecting one tool this week and share what you automate in #wins 🚀
0
0
Dec '25 •
Promo Velocity Forecast Prompt (High-Low Scenario + Confidence Ranges)
Using your current trend data and the details of your upcoming promotion, estimate projected sales velocity and model a range of possible outcomes. Inputs: - Recent trend data (last 4–8 weeks): [insert weekly units or summary] - Promo start date: [insert date] - Forecast time frame: [insert time frame] - Projected promo lift (%): [insert percent] Contextual factors to include: - Promo type and expected impact: [insert promo mechanics and rationale] - Historical promo performance: [insert comparison data, similar offer results, or benchmarks] - External influencing factors: [insert competitive activity, seasonality, retailer traffic, inventory position, marketing support, or distribution changes] - Channel nuances (if applicable): [insert online vs in-store differences, marketplace traffic patterns, or retailer-specific lift expectations] Please calculate the following: 1. Baseline average velocity from the trend data. 2. Anomaly adjustments for stockouts, unusual spikes, or distribution disruptions. 3. Adjusted baseline: baseline after anomaly correction. 4. Promo lift application: apply the projected lift percent to the adjusted baseline. 5. Scenario modeling: 6. Confidence range: provide a high-low band for the forecast. 7. Final forecast: return the projected velocity for the selected time frame (weekly or multi-week/month). Please present the results in a clear table with these rows: - Baseline average velocity - Adjustments for anomalies - Adjusted baseline velocity - Promo lift percent provided - Most likely forecast - High scenario forecast - Low scenario forecast - Confidence range (high and low) - Final projected forecast for the selected time frame After the table, provide a short written summary explaining how the scenarios differ and what operators should watch for during the promo period.
0
0
1-9 of 9
powered by

skool.com/cpg-ai-accelerator-2786
Where CPG founders unlock AI to scale smarter, faster, and leaner — without hiring more. Stay ahead, save time, and grow with the power of AI.
Suggested communities
Powered by