

Jun 5 •
$SPX Up 26% Year on Year
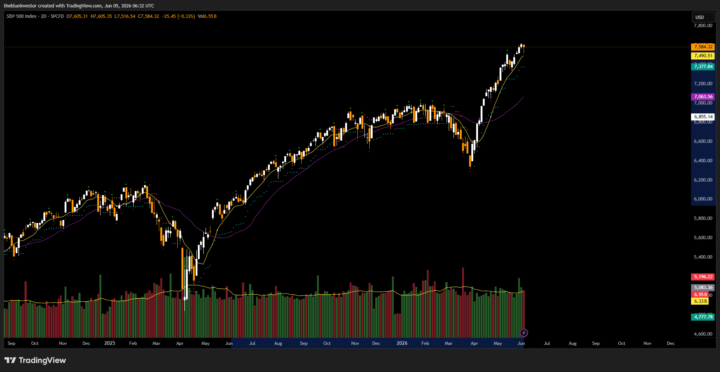
📊 MARKET UPDATE | S&P 500 (SPX) — June 5, 2026 Chart: 2-Day Timeframe | Volatility Stop Indicator Active | 10 & 30 day Moving Averages 🔢 EXACTLY ONE YEAR AGO TODAY On June 5, 2025, the S&P 500 closed at 5,939.29. Today, June 5, 2026, it's trading at 7,584.32. That's a gain of 1,645 points — or exactly +27.70% in 12 months. Let that land. Nearly 28% in one year. If you had simply put $10,000 into an index fund and done nothing — no charts, no indicators, no stress — you'd be sitting on a 27.70% return or $2700 gain. That's the baseline. That's the power of just being in the market. 📈 READING THE CHART This is a 2-day SPX chart with slow (30 day) and fast (10 day) moving average indicators, and the Volatility Stop (VS) indicator applied. The blue dots signal a bullish trending market — a strong, sustained upward move in price. The red dots signal the opposite: bearish or weakening trend conditions. Here's the story the chart tells over the past 12 months: → From mid-2025 into late 2025, the Volatility Stop was printing blue dots as price steadily climbed from below 5,600 toward the 6,000–6,100 range. Trend confirmed: bullish. → Late 2025 into early 2026, we started seeing the dots shift to red as price stalled and began rolling over. That was the warning signal. The market then sold off sharply — dropping all the way to around 6,350 by April 2026. A painful but necessary shakeout. → Then the recovery. Price bounced hard from those April lows, and crucially — the Volatility Stop flipped back to blue at the beginning of April. That was the signal to re-enter the market. The trend resumed. And it resumed aggressively. → Today, price sits at 7,584, trading well above both moving averages on the chart (the short-term yellow MA and the longer-term purple MA), both of which are now curling upward — confirming the bullish structure. --- 🔍 KEY LEVELS TO WATCH → 7,490 — immediate support (previous resistance, now flipped) → 7,377 — short-term MA support zone (first line of defence on any pullback)
0
0
Mar 11 •
Bitcoin Levels To Watch + Huge Tokenization update
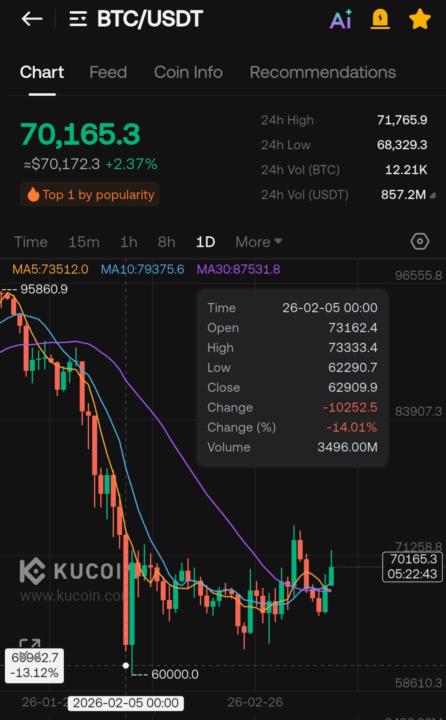
Here's a quick look at what's been happening with the price of Crypto market leader, Bitcoin. We've already had one significant daily close above $71k, but the level I'm eyeing is a daily close above $73 333 (see chart below). Upward momentum should accelerate once we secure that. That last daily candle that closed above $71k incidentally failed to close above $73k. That's where the Final Boss Sellers are that we need to defeat to really go higher. Meanwhile, the Tokenization narrative is heating up!!! 2 Huge things happened over the past 7 days. 1. Popular Crypto exchange affiliate Kraken Financial was granted a Federal Reserve Master account, granting Kraken access to FedWire, the interbank payment system that processes trillions of dollars daily! 2. Nasdaq announced a partnership with Kraken allowing them to distribute 1-2-1 tokenized versions of publicly traded stocks to customers in Europe & other international markets. This opens up the equities space like never before whilst simultaneously signaling the reality: Crypto is now merging with the traditional financial system & will soon completely replace it.
0
0
1-2 of 2
powered by

Suggested communities
Powered by