Activity
Mon
Wed
Fri
Sun
Aug
Sep
Oct
Nov
Dec
Jan
Feb
Mar
Apr
May
Jun
Jul
What is this?
Less
More
Memberships
Strata Market Structure Lab
14 members • Free
2 contributions to Strata Market Structure Lab
Feb 2 •
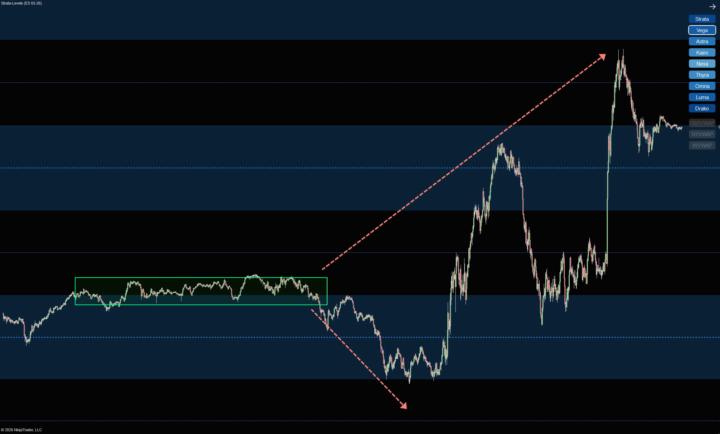
Compression → Expansion Example
This sequence starts with tight compression. Price spent time coiling into a narrow range, overlapping candles, and reduced follow-through. That’s usually a sign the market is storing energy, not going dormant. When structure finally gave way, price expanded quickly out of the range. The initial break moved down, accelerating as stops were triggered and liquidity was taken. But the key wasn’t the direction — it was the expansion itself. Once that downside expansion ran out of fuel, price reversed and expanded even harder in the opposite direction. That secondary move was the real release of energy, not the first push. This is a common pattern in day trading: compression builds energy, the first break clears liquidity, and the true expansion comes after structure resets. Learning to recognize this sequence is more important than predicting which side breaks first. No signals. Just structure and context.

2 likes • Feb 2
Those zones look strong
Feb 2 •
📌 Start Here — Read This First
Welcome to Strata Market Structure Lab. This community exists for one reason: to help futures traders understand why price reacts where it does. Not signals. Not trade calls. Not hype. ✅ What this community is Inside here, I’ll share: - Annotated chart breakdowns (NinjaTrader) - Examples of failed breakouts, traps, and reactions - Explanations of market structure and price behavior - Weekly “why it reacted here” style posts Everything is focused on context and structure — how the market is actually moving under the surface. ✅ What this community is not You will not find: - Buy/sell signals - Entries or exits - Indicator downloads - Settings or scripts - “Just follow this trade” content That’s intentional. The goal here is to help you see the market more clearly, not to copy trades. ✅ About the indicators The charts and explanations shared here are derived from the same framework used in my indicators: - StrataLevels - Level-Force - Flux-Levels - VWAP Percentage Levels - Candle Countdown Flag Those tools are sold and supported on my website, not inside this community. 👉 https://StrataLevels.com This space is where I explain the why.The indicators are the how, plotted live in real time. ✅ How to use this community If you’re new: 1. Browse the chart breakdowns 2. Study the structure examples 3. Read the weekly reaction posts If you’re already a customer: - Feel free to ask questions - Chime in on structure discussions - Help keep this place grounded and practical No hype. No pressure.Just clean structure and real charts. Glad you’re here. Strata-Levels Team
2 likes • Feb 2
Looks interesting, def gonna look into this! I love charts
1-2 of 2

Active 152d ago
Joined Feb 2, 2026