Activity
Mon
Wed
Fri
Sun
Nov
Dec
Jan
Feb
Mar
Apr
May
Jun
Jul
Aug
Sep
What is this?
Less
More
4 contributions to Options Trading for Beginners

Jul 30 •
Free Live Masterclass - Census Count
We’re thinking about running a FREE live masterclass for anyone who wants to actually understand options — no jargon, no fluff, just how the game really works. Before we lock in a date, we want to know: is this something you’d actually show up for? Drop “MASTERCLASS” in the comments if you’d want in, and tell us your #1 question about options trading. We’ll build the session around what you actually want answered. Spots will be limited when we open it up — so if you’re in, let us know now. 👇 Comment “MASTERCLASS” below

1 like • Jul 30
Masterclass!
1 like • Aug 1
I was hoping it would be tomorrow because I have an engagement now....☹️☹️☹️
Jun 28 •
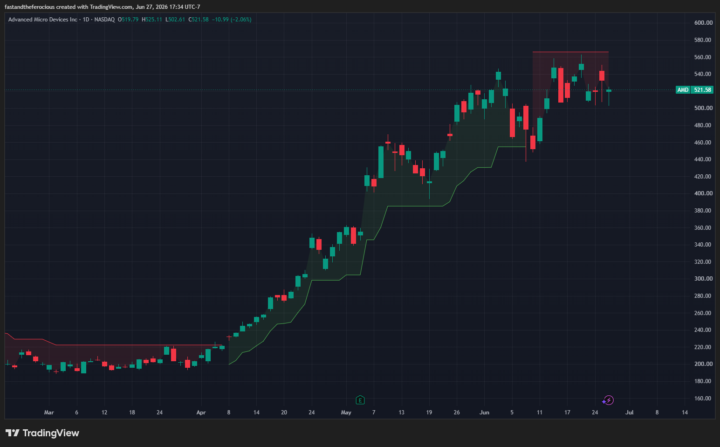
Free indicator breakdown: Supertrend (TradingView)
This one's a freebie for the group — not part of our core VOLT framework, but a solid trend-following tool worth knowing how to set up if you want another lens on the chart. What it does:Supertrend plots a line above or below price that flips sides as the trend shifts — green/below price when the trend's up, red/above price when it's down. Simple visual read on trend direction. How to add it in TradingView: 1. Open any chart and click Indicators (the "fx" icon at the top). 2. Type "Supertrend" in the search bar. 3. Select Supertrend from the built-in list (it's a free, native TradingView indicator — no need for a custom script). 4. It'll load onto your chart immediately with default settings — you'll see the line start plotting above/below price. How to read it: - Line below price, green = trend is up. - Line above price, red = trend is down. - The flip (line jumping from one side to the other) is the signal most people watch — but like any single indicator, it works best paired with something else support & resistance, BSL or SSL rather than on its own. - Drop a "OTB" below if you added this to your chart today.
0 likes • Jun 30
@Morris Lim thanks for asking. I didn't know.
Jun 27 •
Welcome! Introduce yourself + share a pic of your workspace 🎉
Let's get to know each other! Comment below sharing where you are in the world, a photo of your workspace, and something you like to do for fun. 😊
1 like • Jun 29
Hi all! My name is Wanda and I'm Swampfoot's Mother. He's trying to teach me how to do options and had me join OTB for extra help. I've enjoyed and learned much since joining.
Jun 29 •
Bollinger Bands (optimized settings) with Anand
Most beginners trade Bollinger Bands backwards. Price hits the upper band → they short. Price hits the lower band → they buy. Feels logical. Loses money. Here’s the truth: Bollinger Bands don’t measure direction. They measure volatility. Price can ride the upper band for days straight in a strong trend — and if you’re shorting every touch, you’re getting run over. New lesson breaks down: → What BB are actually telling you (it’s not what you think) → Why “band touch = reversal” is a beginner trap → The squeeze — tighter signal than most people realize → How to read bands WITH trend, not against it This is one of the most used, most misread indicators out there. If you’ve ever gotten faked out chasing a band touch, this one’s for you. Drop a 🔥 if you’ve been burned by this before. https://youtu.be/8Z4eJEww8Aw?is=MvVQ6GvI_uuFqt3g
1 like • Jun 29
Thank you for this explanation of how and what BB is and does! Great example!
1-4 of 4