Activity
Mon
Wed
Fri
Sun
Jan
Feb
Mar
Apr
May
Jun
Jul
Aug
Sep
Oct
Nov
Dec
What is this?
Less
More
Memberships
InvestCEO with Kyle Henris
38.6k members • Free
3 contributions to InvestCEO with Kyle Henris

29d •
Link for tonight's workshop
I signed up two or three times for the workshop but never received the link. My spam/junk folder do nto have anything about this either. Last night unfortunately I could not connect, but tonight I am ready and can't find the link. Can someone share it please?
0 likes • 29d
It is strange because I normally receive emails without any issues from InvestCEO. Not sure why I did not receive the link regarding the workshop
0 likes • 29d
I found the email! thank you!
Oct 24 •
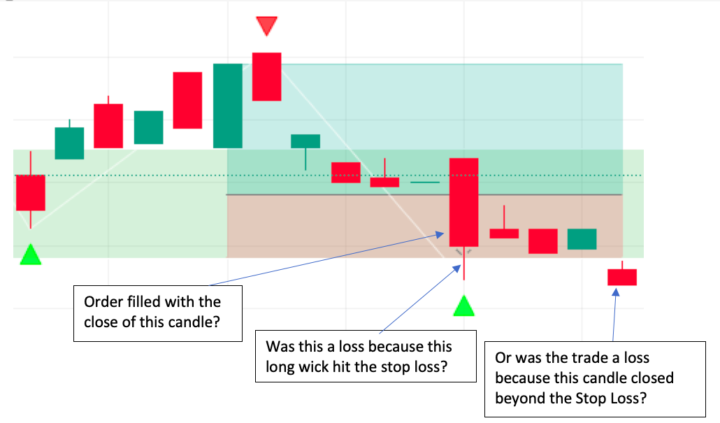
Questions about the anatomy of a trade
Hello everyone! The Superman entry below is on the 5M chart, while the demand block was identified on the 1H chart (which is why it’s wider than the first red candle on the left). I know this trade ended in a loss, but I have a couple of questions: • Did the entry get filled with the longer red candle in the loss zone, or did it get both filled and stopped out at the same time because the long wick hit the stop loss? • If it was only filled by that red candle, then did the loss occur when the last red candle closed beyond the stop loss — and not earlier, even though some of the candles in between also closed within the risk zone? Thank you!
1 like • Oct 24
@Stephen Gerald Onyia Thank you!

👑
Oct 14 •
A week of presents for you! 🎁
This week just happens to be my birthday week. So I figured what better way to celebrate then to give my InvestCEO community a bunch of gifts! (That is how birthdays work right?) Each day this week, Monday through Friday, I’ll be dropping a new gift in the Skool community. The one on the 17th (my birthday) will be EPIC. Today’s gift is also cool. Several of you have asked about getting your hands on the recordings of my 5-day ‘AI Day Trading Revolution’ workshop… …and I’m here to deliver! We’ll send all 5 days of value packed recordings your way. ✅ Just comment “WORKSHOP” below if you want them.
1 like • Oct 14
Workshop
1-3 of 3

@sandra-qr-2095
I’m a stay home mom with big dreams to become financially independent.
Active 5m ago
Joined Sep 25, 2025
Powered by