Activity
Mon
Wed
Fri
Sun
Aug
Sep
Oct
Nov
Dec
Jan
Feb
Mar
Apr
May
Jun
What is this?
Less
More
Owned by Russell
Stop memorising chart patterns. Start understanding the mechanics underneath. No signals. No fluff. Just the physics behind the chart.
Memberships
Skool Growth Free Training Hub
8.6k members • Free
Community Builders - Free
11.5k members • Free
Skoolers
168.5k members • Free
Stock Trading for Beginners
4.8k members • Free
Digital Products Academy
8.7k members • Free
AI Automation Society
416.7k members • Free
2 contributions to Trading Beyond Charts

8d •
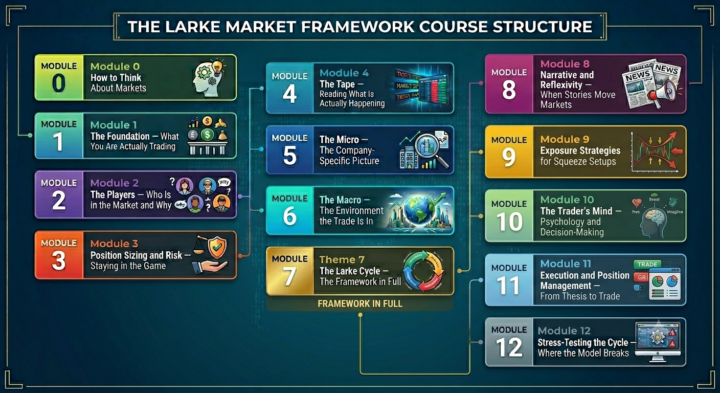
The Structure Behind the Chart
WTF am I doing wrong? (Or, a very good place to start). Here's the answer: nothing, and everything. You weren't undisciplined. You were trading a shadow and calling it the thing itself. But there's no short answer to that, and no shortcuts either. If you want one, this isn't the course for you. This course works just as well for the complete beginner as it does for someone more advanced who's skipped a few steps without realising it, and never quite saw the full implication of a topic, or more importantly, how each topic affects the next, like components in a system. Especially if you've put a lot of trust in chartism. The value here isn't in having some knowledge of a lot of siloed topics, it's in the connections between them, and what they add up to. How the chain reaction actually produces the price movement you're looking at. What happened to produce the pattern you are witnessing, why that does sometimes show a trend and what forces can push it one way or another from there. Understanding things to this level, makes for better decisions. I'm Russell. I've been trading for over a decade. I hold a BA (Hons) in Business Management and have run my own businesses, and I'm currently studying for an MSc in Systems Thinking, the discipline used to understand climate feedback loops, supply chains, and complex adaptive systems. This course is the intersection of everything I've learned. Here's what that chain reaction actually looks like up close. The pattern you traded was real. The breakout, the setup, the textbook entry, none of it was imaginary. But a chart pattern is a shadow, a low-definition flicker cast by the high-definition, living reasons moving underneath it: short interest, borrow availability, liquidity, positioning, catalysts. The shadow can look identical two days running while the thing casting it has completely changed shape. Nobody taught you to check the thing casting it. That's not a discipline problem. That's a gap in your education, and it's the one this course exists to close.
0
0
1-2 of 2

@russell-larke-7832
I'll fill this in later :), I'm just checking out the app to see what it is like.
Active 14h ago
Joined Jun 24, 2026