Activity
Mon
Wed
Fri
Sun
Oct
Nov
Dec
Jan
Feb
Mar
Apr
May
Jun
Jul
Aug
Sep
What is this?
Less
More
Memberships
AndyNoCode
21.1k members • Free
A.I. Business Academy (Free)
4.7k members • Free
Plan Automate Metrify
19 members • Free
Kickstarter Challenge
20.9k members • Free
Real Men Real Style Community
13.1k members • Free
salesreps.com
149 members • Free
Kourse (Free)
111.8k members • Free
AI Automations by Kia
18k members • Free
Web Agency Accelerator (FREE)
12.4k members • Free
2 contributions to salesreps.com

13d •
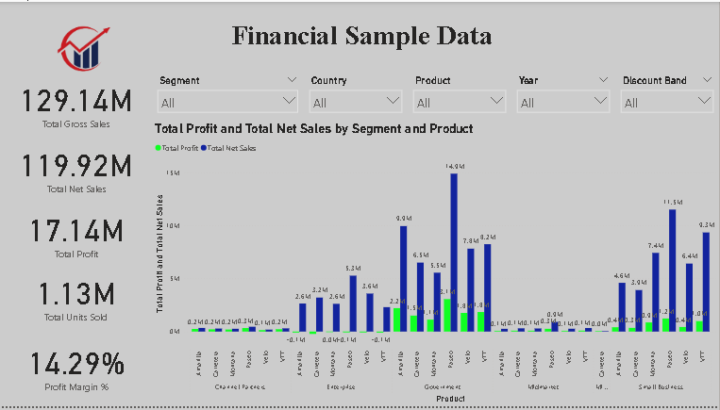
📊 Financial Sales & Profitability Dashboard (Power BI)
🔹 Business Problem Addressed Organizations struggle with tracking the financial impact of discounts, understanding profitability across segments, and identifying growth trends. This project focused on creating a finance-ready dashboard to provide actionable insights into sales performance, cost management, and profit margins. 🔹 Key Metrics & Insights Total Sales, Net Sales, Gross Sales – revenue tracking Profit & Profit Margin % – profitability evaluation Discounts Impact – revenue leakages due to discounting Units Sold – demand measurement Trend Analysis (Year-Month) – seasonality and growth Segment, Product, and Country breakdowns – performance analysis across business dimensions 🔹 Visualizations & Reasoning Cards (KPIs): Quick overview of Sales, Profit, Units, Profit Margin. Waterfall Chart: Shows flow Gross Sales → Discounts → Net Sales, highlighting discount impact. Clustered Column Chart: Compare Sales & Profit by Product/Segment. Scatter Plot: Correlation between Discounts vs Profitability. Line Chart (Trend): Detect growth or seasonality in Sales & Profit over time. Treemap/Matrix: Identify top-performing products by sales/profit. Map: Geographic performance by country. 🔹 Design Enhancements Consistent colors: Blue for Sales, Green for Profit, Red for Discounts. Data labels for readability. Segmented layout: KPIs (top row), Product/Segment (middle), Trends & Geo (bottom). Clear narrative: from overall performance → drivers of profit → actionable insights. 🔹 Narrative / Business Story The dashboard revealed that discounts significantly reduce net revenue, with certain products/segments contributing more profit than others. Profitability varied across geographies, and trend analysis exposed seasonal fluctuations in sales. 👉 Business Action: Optimize discounting strategies, focus on high-margin products, and leverage seasonal demand patterns for better financial outcomes. 🔹 Impact 📈 Delivered a clear financial picture linking sales, discounts, and profit.
1
0
22d •
Hello Need Help
Hello Dear Group Members I need Your help I am Data and business analytics Power Bi developer I am looking for a remote role Can i get this role in this group Give me reply Yes or No
Poll
Cast your vote
1-2 of 2

@muhammad-affaf-9775
I am Business Analysis Complete my project and course looking for a work
Active 2d ago
Joined Sep 3, 2025
Karachi Pakistan
Powered by