Activity
Mon
Wed
Fri
Sun
Feb
Mar
Apr
May
Jun
Jul
Aug
Sep
Oct
Nov
Dec
Jan
What is this?
Less
More
Memberships
Investor Edge Club
10 members • Free
37 contributions to Investor Edge Club
4d •
Watchlist for trading
Hey everyone - just wanted to know how big everyone's watchlist is for trading? Do you all focus on just a few pairs or are you scanning several ones to try and find every and any opportunity? I usually keep my watch list capped at 5. NDQ/DJI/Gold/USDJPY/EURUSD Now getting a bit of FOMO after seeing that silver chart 😅🤣


🔥
4d •
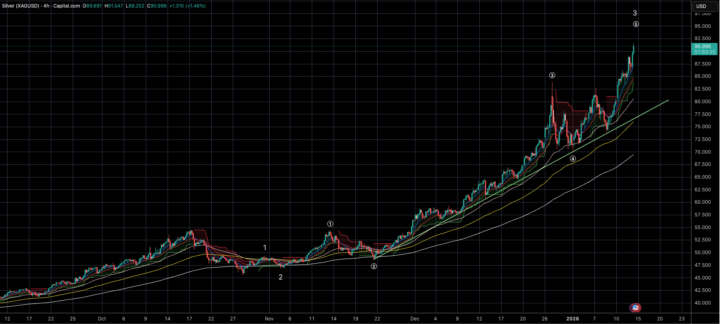
Silver - Shining As Bright As Gold
Date: 14/01 I don't usually put out the silver chart analysis but its movement is too good to ignore. These days every time I look at the silver price it seems to be 10% higher than when I last checked in. The structure is a complete buy the dip with a current buy zone emerging around 85 - 87 levels. For now 74.549 can be used as a tight stop loss for any long positions created in this buy zone. We are currently in the 3rd wave of this impulse that has itself gone into extensions. Best not to try catch the top and use any dips to buy and/or build a long position. Posting the 4H chart below.
2 likes • 4d
Wow 🔥🚀 Silver has been on such a roll! I don't directly trade in it since i try focus on gold but i do look at the charts from time to time. Very tempting to jump in on the trend!
🔥
6d •
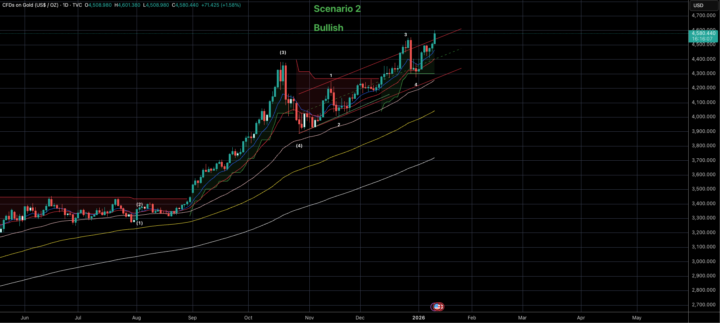
Gold Finally Breaks Out!
Date: 12/01 We've finally gotten a confirmation on Gold. In our last post we'd shared 2 scenarios with key levels on both sides which we were waiting to be breached. Seems like our bullish scenario is playing out now with 4274 forming the 4th wave low and the 5th wave moving up in an impulse from there. This last dip down did not break into wave 1 territory and held gold's bearish breakdown level. Sharing a daily and 4H chart below.
1 like • 6d
Nice .. Your markings are really clear .. also does this mean the bearish scenario is done?
🔥
8d •
🧠 Why Markets Confuse Most People (And How to See Them Differently)
Most people look at a chart and ask:➡️ “Is this going up or down?” That’s the wrong question. The better question is: ➡️ “Where are we in the cycle?” When you don’t know the phase: - You buy late - You sell early - You panic during pullbacks - You chase strength when risk is highest When you do know the phase: - Corrections feel normal, not scary - You stop reacting to every candle - You make calmer, more informed decisions 📌 This is the core idea behind how we analyse markets here.Not prediction. Not hype.Just understanding context. 💬 Question for you: When price pulls back, do you usually see it as: A) A warning B) An opportunity C) Noise D) Depends on the structure Drop your answer below 👇(There’s no “right” answer — this is about awareness.)
2 likes • 8d
When investing in a stock or ETF that i've mapped - I see it as an opportunity While trading - depends on the structure
🔥
11d •
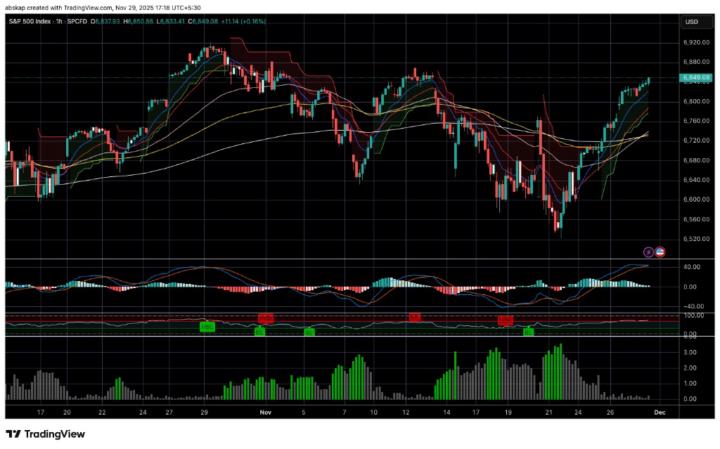
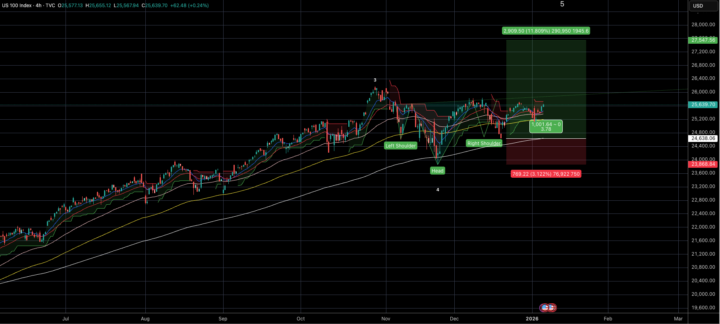
NDQ - Already at 1:1 profit
Date: 07/01/2026 Our Nasdaq trade has already given more than a 1:1 return and we are holding strong with an eventual target of 27500 which is still intact. Usually at these junctions I would recommend a little bit of profit booking and moving our stops to break even. There's nothing worse than a winning trade going into negative. Once we convincingly break past the neckline - a fresh trade can be initiated. If our counts are correct - the inverted H&S Target will be achieved during the 5th wave of this impulse and if our previous bottom holds we've already begun the journey upwards.
1 like • 11d
Legend
1 like • 11d
Waiting for the break above the neckline to add more!
1-10 of 37