Activity
Mon
Wed
Fri
Sun
Aug
Sep
Oct
Nov
Dec
Jan
Feb
Mar
Apr
May
Jun
Jul
What is this?
Less
More
Owned by Gerald
Memberships
Skoolers
164.7k members • Free
30 contributions to Wealth Blueprint Society

Oct '25 •
The Psychology of Money: Thought Exchange
Share your worksheet answers here so I can review them before our 1-on-1. This gives us both a chance to see your progress and pinpoint the lessons that stood out most to you. During our session, we’ll dig deeper into those ideas and translate them into practical steps you can apply right away.
1 like • Jan 19
Being paranoid is a gem 💎. Can’t go broke if you save like every dollar is needed.
1 like • Feb 19
@Kymaunii Godfrey one step closer to the finish line.
Feb 11 •
Retirement for Beginners (No Fluff Version)
If you’re just starting, forget the noise. Here’s what actually matters. Retirement is not about hitting a magic number. It’s about replacing your paycheck when you stop working. Start with this order: 1. Understand the goal You’re not saving to feel good. You’re saving to create future income. 2. Save consistently before you save aggressively Small, steady contributions beat big emotional ones. Consistency builds habits. Habits build outcomes. 3. Know the difference between account types 401(k)s & traditional IRAs = taxed later Roth accounts = taxed now, tax-free later This matters more than people realize. 4. Invest for growth early Time is your biggest advantage. Being too conservative too soon is a common beginner mistake. 5. Inflation is the real enemy Money sitting still is losing value. Your plan must grow faster than prices rise. 6. Retirement is income planning, not savings planning At some point, you’ll need to answer: “How does this money pay me every year?” 7. You don’t need perfection, you need direction Most people wait too long trying to “learn everything.” Start. Adjust later. Bottom line: Beginners don’t fail because they start small. They fail because they never start with a plan. This is step one.
Jan 23 •
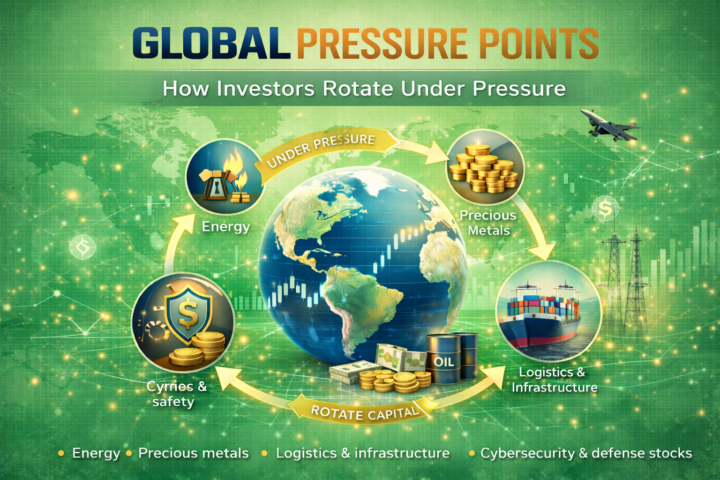
GLOBAL PRESSURE POINTS How Investors Move When the World Tightens (Third in the Global Pressure Points series)
By now one thing should be clear. This isn’t about one country. It isn’t about one conflict. It isn’t about one headline. It’s about pressure. And pressure always exposes what really matters. Most portfolios are built for calm environments. Stable supply chains. Predictable trade. Low disruption. Global pressure breaks those assumptions. And when assumptions break, money moves. Smart investors don’t ask, “What’s trending?” They ask, “What becomes scarce?” “What becomes protected?” “What must governments buy no matter the cost?” “What systems can’t be allowed to fail?” Historically, when the world tightens, capital rotates toward: Energy Real assets Precious metals Industrial commodities Logistics & infrastructure Cybersecurity & defense systems Currency safety Not because of fear. Because of necessity. Conflict strains supply. Strains supply create inflation. Inflation forces repricing. And repricing creates both opportunity and damage. This is where investors separate themselves. Not by predicting war. But by understanding what pressure does to economies. Early stages bring volatility and safe-haven flows. Middle stages shift capital into resources and production. Later stages move money into rebuilding, infrastructure, and long-term contracts. The goal isn’t panic. The goal is positioning. Awareness. Structure. Risk management. Strategic exposure. Global pressure doesn’t destroy wealth. It transfers it. And investors who understand that don’t react. They reposition.
0
0
Jan 20 •
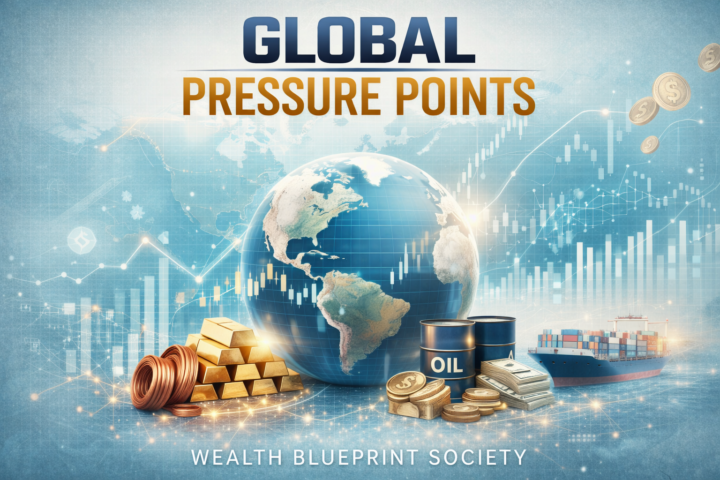
GLOBAL PRESSURE POINTS Greenland, Colombia & the New Chessboard (Second in the Global Pressure Points series)
Once people hear “war,” they picture tanks and cities. But modern conflict doesn’t start with explosions. It starts with positioning. Shipping lanes. Mineral deposits. Energy corridors. Borders. Data routes. That’s why places most people never talk about suddenly matter. Greenland isn’t trending because it’s cold. It matters because what’s under it is valuable. And what moves around it is strategic. Rare earth minerals. New Arctic shipping routes. Military surveillance positions. Control over access between continents. At the same time, regions like South America become sensitive not because they want war… but because instability spreads. Colombia matters not for headlines… but for borders, trade flow, security pressure, and who influences the region. And this is what investors have to understand. The new chessboard doesn’t look like old wars. It looks like competition over: energy metals food systems shipping routes digital infrastructure This is the slow-burn version of conflict. And slow-burn conflicts quietly reshape money. They change what the world protects. They change what the world pays for. They change where capital is forced to go. This is the second pressure point. And the pattern is getting clearer.
0
0
Jan 18 •
GLOBAL PRESSURE POINTS Venezuela Wasn’t Random (First in the Global Pressure Points series)
We started this year with political tension, global instability, and pressure building in places most people don’t even pay attention to. And for most people, war is just politics. Another headline. Another argument. Another debate. But investors don’t look at war the same way. Most people see war as politics. Investors see war as positioning. Venezuela isn’t just a country. It’s oil. It’s minerals. It’s shipping access. It’s foreign influence in the Western Hemisphere. So when you hear about U.S. action in Venezuela, don’t stop at the headline. Ask yourself: Who controls the resources? Who controls the trade routes? Who controls the alliances? Because war rarely starts where it ends. It starts where money, energy, and power intersect. For investors, this isn’t about picking sides. It’s about recognizing patterns. When regions destabilize, energy gets repriced. Commodities get repriced. Insurance gets repriced. Currencies get repriced. War is inflationary. Uncertainty creates winners… and wipes out the unprepared. This is the first pressure point. And it won’t be the last!
0
0
1-10 of 30

@gerald-mckoy-6717
Entrepreneur & coach teaching financial psychology, credit, and, investing for generational wealth. https://tidycal.com/yrugerald/rapidclaritycall
Active 27d ago
Joined Aug 23, 2025