Activity
Mon
Wed
Fri
Sun
Aug
Sep
Oct
Nov
Dec
Jan
Feb
Mar
Apr
May
Jun
What is this?
Less
More
Owned by Gary
How to use options to reduce risk in a portfolio. You can use this for all stocks and commodities but we going to trade Crude oil and oil options.
Memberships
Options Jive
195 members • Free
The Options Academy
227 members • Free
Stock/Option Trading Academy
52 members • Free
Skoolers
168.3k members • Free
6 contributions to Options Jive

May 15 •
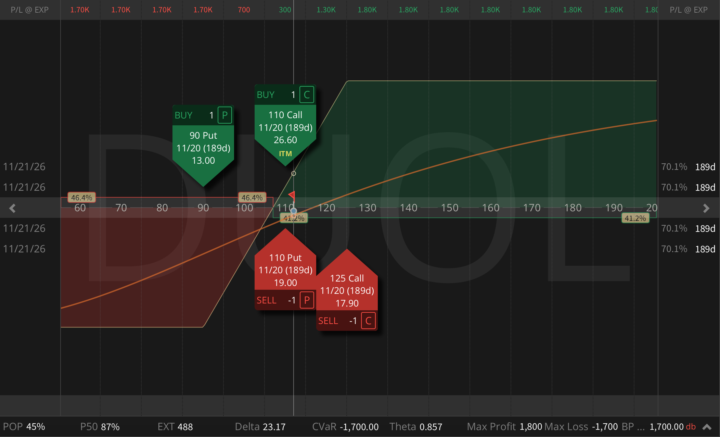
Duolingo: The Most Aggressive Trade Idea I've Shared in a While
Let me be upfront about something before I explain the trade. This has a 45% POP, and most of what I run sits at 70-80%. But still, I'm still putting it on. Let me tell you why. DUOL went from north of $500 in mid-2025 to $110 today, but that's not a struggling company. That's a company that just printed $292M in quarterly revenue, 26% YoY growth, 29% adjusted EBITDA margin, over $1 billion in cash, zero debt, and an active buyback (buying back 514K shares last quarter alone, about 1% of the float in a single quarter). The market re-rated it from hyper-growth AI darling to a profitable-but-slower consumer app. That shift already happened, and it's already in the price. Now here's the part that caught my attention from an options perspective. Into last earnings, the implied move was 15%. The actual gap was about 5.6% down. The market priced a catastrophe and got a mediocre quarter with conservative Q2 guidance. This is a volatile underlying between events, but the one-day gap risk that weekly options price in has been consistently richer than what actually happens. My Trade Idea November 21 expiration, four legs. - Buy 90 Put @ 13.00 - Sell 110 Put @ 19.00 - Buy 110 Call @ 26.60 - Sell 125 Call @ 17.90 The short 110 put and long 110 call together create a synthetic long at the current price. The 90 put is the hard floor, loss stops there. The short 125 call caps the upside but brings the cost down significantly. I entered this for approximately $300 credit. Max profit around $1,800. Max loss capped at $1,700. Buying power used: $1,700. One note on execution: liquidity on this name isn't perfect across all four legs. I had to be patient with the fill. Don't chase the mid, give it time. A few cents of slippage across four legs adds up fast on a structure like this. What I'm Actually Betting On The easy money shorting DUOL from $500 has already been made. At $110, with a billion in cash and no debt, the tail risk isn't "this company goes to zero". In my personal view, the risk is that the market decides slower growth deserves an even lower multiple, and it grinds down another 15-20% from here before stabilizing.

2 likes • May 17
I like your synopsis but my strategy would be to buy 100 shares at $112.00. Then STO 1 Sept 115 put at $20.00 ( DUOL will have to get to $108ish ). If DUOL is above $115 ( 2.80% move up in 4 months ) I make $23.00 ÷ 112 or 20%. However, my strategy dictates I use a BTC at 25% of my STO price so in this case $5.00. Summer is a tough time for any positions other than gold to appreciate. Sell in May. Go away.
Apr 29 •
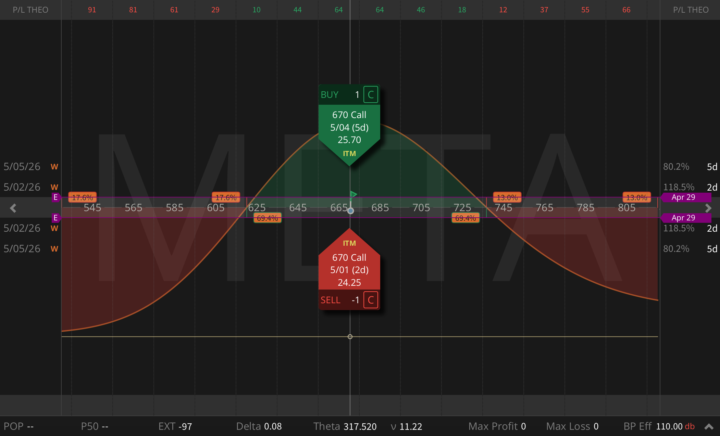
GOOGL, META, AMZN, CMG: What the Volatility Surface Tells Me Before the Print
GOOGL, META, AMZN, CMG all print after the close. I've been running the numbers on this cluster for the past few days. The volatility picture is genuinely interesting because of where the mispricings are, and why they exist. Earnings are the most violent binary event in options trading. The volatility surface completely distorts. IV inflates on the front expiries, skew steepens, term structure flattens or inverts. The 3D surface looks nothing like a normal trading day. And after the print, all of that unwinds. Most traders try to guess the direction. That's the wrong game. My edge is in reading the 3D surface. So here's what I see tonight across these four names, and what I'm doing about it. 1. GOOGL Earnings Jade Lizard Sell 310 Put, Sell 350 Call, Buy 355 Call, net credit $610, Probability of Profit 84%. Let's start with the most important number in this entire cluster: GOOGL's six-quarter realized/implied ratio is 0.49. Average realized move 2.64%, average implied 5.36%. Realized exceeded implied exactly once out of six earnings. The options market is consistently paying double what the stock actually delivers. What makes this genuinely strange is that the fundamental picture is strong. Cloud growing 61% year-over-year. Search re-accelerating; the last print was a clean beat (EPS 2.82 vs 2.58), but stock ended essentially flat. The market priced a 5%+ move, got nothing. What's happening is that the AI capex narrative is functioning as a permanent fear tax on GOOGL's volatility surface. The story keeps options elevated. The stock keeps ignoring it. That wedge is the edge. Tonight's implied move is 4.67%; still rich versus a six-quarter realized average of 2.64%. My Earnings Jade Lizard fits the situation for a specific reason. The real risk in GOOGL tonight is actually to the upside. If the Street decides to finally bless the Cloud backlog and Gemini monetization story, you could see a genuine upside re-rating. The call spread eliminates that completely.
0 likes • May 4
Your broker allows you to short puts without margin ?
Apr 21 •
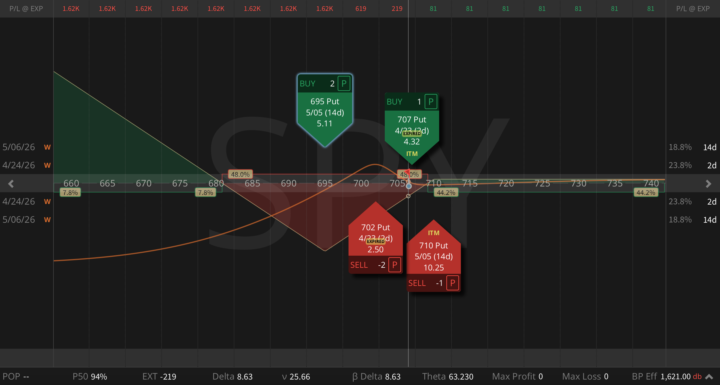
The most powerful way to capitalize on the upcoming correction: the Calendarized Ratio-Backratio Spread
I waited for market close before posting this on purpose. This trade takes time to sit with, it's not something you copy during the session. It's a two-layer construction where each layer is useless alone and extremely powerful together. So I want you to read it slowly. 48 hours of escalation (US seized an Iranian tanker, Iran fired on vessels, Hormuz traffic hit again, a US naval force still blockading the Strait), equities dipped only 0.6%, oil spiked 5%. The "talks on" narrative via Pakistan is keeping the S&P near record territory even as Trump renews bombing threats. I can see the pattern: relief rally on peace-talk headlines, sharp but brief risk-off when a deadline slips or a tanker gets hit, and short-dated index volatility compresses between events. Crude still gaps 3-10% every time Hormuz makes the wire. That's the regime I built this trade for. Front leg: put ratio spread, 1 DTE - Long 1 x 707 Put @ 4.32 - Short 2 x 702 Put @ 2.50 - Net credit: $68, peak value at 702 is around $568. Back leg: put back-ratio, 14 DTE (the Trump hedge from my last post) - Short 1 x 710 Put @ 10.25 - Long 2 x 695 Put @ 5.11 - Net credit: $3, essentially free. Pays big below 680, loses in the valley around 695. On their own, neither leg is impressive. The front has unlimited downside below 696. The back has a nasty valley at 695. If you showed me either one alone, I would pass. But together, the math changes. The combined Greeks (initial): Delta: +8.63, Vega: +25.66, Theta: +63.23, P50: 94%, BP effect: $1,621 Positive theta AND positive vega at the same time - most theta-positive trades bleed on volatility expansion, and this one gains on it! The front ratio is short vega. The back backspread is more long vega than the front is short. Net long vol. The front is 1 DTE, so theta is concentrated and large. The back is 14 DTE and decays slowly. Net positive theta of about $63/day. Both Greeks line up in my favor. That is the trick: the shared wing.
2 likes • Apr 22
I am in the process of utilizing AI to construct and time my options market activity. 99% of my options trading is on the short side. Today my program asked me if I wanted it to automate my trading strategy. Lol. Have you tried implementing AI in your trading ? I graded out at a 9.6 out of 10 by my Arificial Intelligence software. I've been doing this for 46 years. Game changer. Doubled my Portfolio return starting the first month.
Mar 25 •
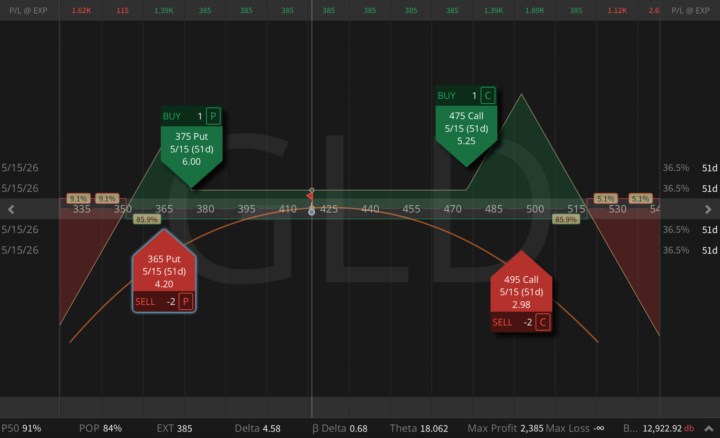
How to Trade Gold Strategically Right Now (3 Trade Ideas)
Gold just posted its worst weekly decline in over 40 years, during an active Middle East war, with oil in triple digits and the Strait of Hormuz partially closed. Every macro textbook says that combination is powerfully bullish for gold, but instead, spot dropped roughly 20% from the all-time high. In my view, this was not a fundamental repricing of gold's long-term value. This was a forced deleveraging event. The oil shock drove inflation expectations high enough to keep the Fed hawkish, real yields stayed positive, the dollar surged, and months of crowded, leveraged long positioning (expressed heavily through structures targeting 5,500-6,000) unwound into thin overnight books. Order depth on COMEX reportedly collapsed by over 90% during the worst session. So I see this as a liquidity cascade. The critical tell; equities VIX is sitting in the high 20s. GVZ (the gold vol index) spiked above 43 last week, a 55% move in five days, to levels last seen during the 2020 pandemic panic. Gold volatility is now trading at a ratio to Treasury volatility last seen just before the 2008 Lehman collapse. That spread is a volatility surface that is still pricing a crash that has already happened. Below are three structures I'm using right now, all in GLD and all expiring 5/15, to monetize that dislocation in three different, but very smart and strategic, ways. Trade 1: The Double Batman Structure: Buy 1 x 380 Put / Sell 2 x 360 Put / Buy 1 x 475 Call / Sell 2 x 505 Call, all 5/15 (51d) Net credit: $815, Probability of Profit: 87%, Max Profit: $3,815, Theta $36/day This is the broadest and most neutral of the three setups, built around one core idea, that GLD stays inside a wide consolidation range while implied volatility mean-reverts. I'm selling inflated premium on both wings of the surface, while keeping a defined body inside the trade and leaving the far tails for active management (if needed). The payoff shape creates two separate profit humps, which is why I call it the Double Batman. I'm harvesting premium that is still stranded in both tails after the recent liquidation event, while gold itself is trying to stabilize.
0 likes • Apr 3
I am in the initial phases of designing an app that displays an equity and its option on the same chart in real-time. This way a trader can see both at once. Have you seen an app or service that provides this ?
Apr 2 •
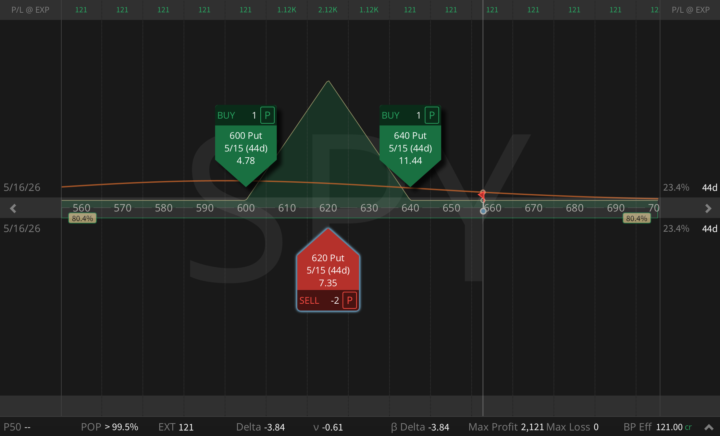
SPY Risk-Free Butterfly
We did it again! If you follow, on March 23 we opened a SPY 640/620 put ratio spread for a $598 credit. Yesterday, I bought the 600 put for $4.77 and turned the entire position into a RISK-FREE butterfly. Now the trade has: - No downside risk - No upside risk - Locked-in profit: $121 - Max profit: $2,121 This is how short volatility works when we stop thinking directionally and start thinking in structures.
0 likes • Apr 3
All my members ( 7 ) are new to trading so I'm having to educate them about how options work and help reduce risk while at the same time instructing them on how to open an account. It's free for them but as I stack month after month of outperforming the DJIA it will eventually become a pay-site. Yesterday I bought VG at $14.51 as an initial purchase and shorted April 10th 15 puts at $1.00. If VG goes up 3 1/2% in a week I make 10%. If not, I own twice as many shares at an avg of $14.75. My portfolio has returned 12.50% since its inception on March 6th as compared to a - 4.5% return for the DJIA over the same time period.
1-6 of 6

Active 45d ago
Joined Feb 24, 2026