Activity
Mon
Wed
Fri
Sun
Jul
Aug
Sep
Oct
Nov
Dec
Jan
Feb
Mar
Apr
May
What is this?
Less
More
Memberships
Ship 30 for 30
4.6k members • Free
Legacy Profits Club
23 members • $15/m
Legacy Profits Club
193 members • Free
Category Newsletter Creator
1.7k members • Free
8 contributions to Legacy Profits Club

Jan '25 •
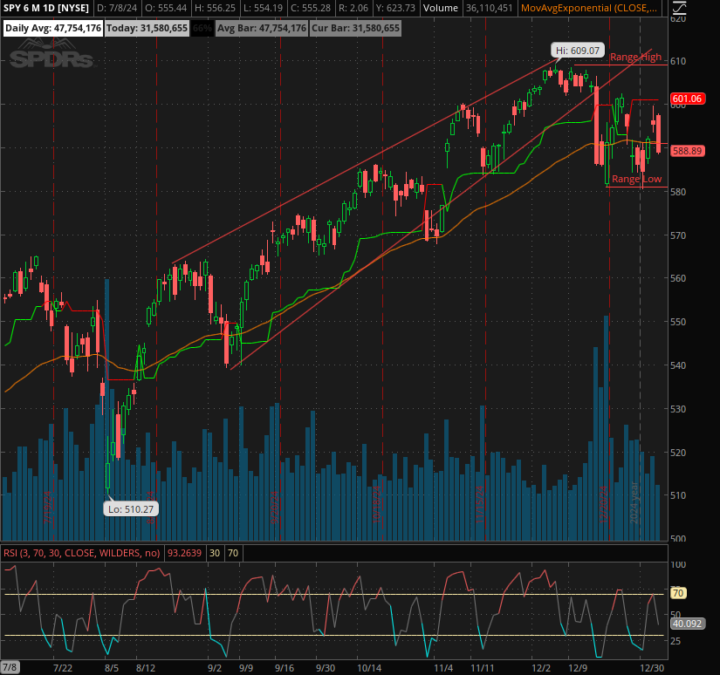
What Does it Mean to Buy Low and Sell High?
This is something that is talked a lot about by people on social media, but what does that look like practically? Let's dive in... The concept of buying low and selling high makes a lot of sense. Would you rather buy something on sale or at a premium? Would you rather buy inventory for your business at a discount or at market price? This is why it's best to look for "sales" in stocks. Another way to look at it would be to buy fear and sell greed. Red days can provide some great long entries and big green days are great days to take profit. So, let's get practical. Look at the picture attached to this post at the daily chart for SPY. Until recently, SPY was putting in higher highs and higher lows on the chart. It was in an uptrend that you can see visualized by the lines on the chart. What does it mean to buy low and sell high? Well, you could have bought at any one of the higher lows on the chart as it touched the trend line and made great profits with safer entries. OR...you could even have bought the trend line touches to the downside and sold multiple times as the stock touched the overhead trend line and made lots of money. Now, let me give you a quick idea of how you can spot these trends yourself with a couple of tools. On the chart in the attached picture I have two indicators that will make this even easier. First, that orange line is the 50 period exponential moving average. It is a good trend indicator for the daily chart. If price is above it, then it is, in most cases, trending upwards. If price is below it, then it is, in most cases, trending downwards. Then, we add the 3 period RSI underneath the chart. When it's blue, that means that the market is oversold. If it's red, that means it's overbought. How can we put these together? When we're in an uptrend (price is above the 50 EMA) and the market is oversold (RSI is less than 30). There's a higher likelihood that we are putting in a low and it's a good "long" opportunity to buy low. Those two indicators work GREAT in a trending environment to spot short term bottoms in an uptrend and tops in a downtrend and can work in your favor to combat the fear and fomo that you find all over social media.

0 likes • Jan '25
This is great!
Nov '24 •
Updates to the Course and How to Use the Legacy Profits Club
Super excited to launch the Legacy Profits Club this week. Some things in it will feel very familiar. Some things will be completely new! The goal is to help you start making consistent money in the market. So, let's talk about how to get the most out of it. Risk Management: Stop Losses: I'll be giving the exact entries and exits on each trade as well as the stop loss requirements. Position Sizing: I always base my position size on the potential downside risk. Here's what the grading system will look like: - A+ trades : Best risk to reward ratio, full position size. - A- trades: Good potential, slightly higher risk, 75% position size. - B trades: Moderate risk, half position size - C trades: Highest risk, 1/4 position size. Make sure you have watched the risk management portion of the course AND I highly recommend the risk management workshop I'll be hosting next week to fully understand risk on these setups. Trade Execution: As long as market conditions allow, I plan to release 3 trade ideas each week to the legacy profits club: - Earnings trades: Notifications on as I will only give a few minutes notice on these. - Small cap swing gaps: Set and forget trades. These will last from a day to a month. - Wheel Strategies: This will be for those with medium size accounts to generate income while waiting on long term investments. Updates to the Course Tab: This is a BIG ONE! To make it simple, I've simplified the trading course by removing some of the setups and adding some NEW setups for you to learn. Go watch them ASAP! Let's make some money next week! ✌️- Derek P.S. Let me know any questions you've got or what you're most excited about in the comments!

3 likes • Nov '24
This is sick m!
Oct '24 •
The Terrifying Habit that will Change Your Trading Forever
No one likes to lose money on a trade. Call it pride, call it embarrassment, call it whatever you want. You want to know what feels worse than losing on a trade for most of us? Sharing our losses with others. I know exactly how this feels. I put myself out there in our Pro Community every single day with a trading plan. This means that there's no covering up my mistakes or bad calls. But do you know what else sharing my trades (including my mistakes) does for me? It makes me a better trader. Why? 1. Accountability When I know that other people are looking at my trades, I'm far less likely to do something stupid or emotionally trade. I'm going to be far less likely to see something that isn't there. And, if I'm making the same mistakes over and over again, you better believe that people are going to call it out. 2. You learn more from losses than wins. Most of the time when we win, we don't take the time to analyze our wins. Instead, we go straight to celebrating. This can even reinforce bad trading habits if we aren't careful because we got away with mistakes. Our losses are painful. They force us to look inside and analyze what went wrong. What's even more painful? Sharing those losses with others. Yet, it's sharing those losses that can help us break through the ceiling of our own trading. Sometimes, we don't even know what's going wrong. Sometimes we don't see that we are making the same mistakes over and over again. But do you know who does? Others when we share them. 🤫 Let me let you in on a secret. 🤫 I've been teaching traders for a long time and I can tell when people are losing. You know how? They stop sharing. Whether it's posting screenshots on social media or posting in the chats, everyone feels comfortable sharing a win. When it gets quiet, I know people are struggling in silence. IT SHOULDN'T BE THIS WAY! When you are struggling with your trading, you should do the very thing that everything inside of you screams not to do - share your struggles.

5 likes • Oct '24
This is why I am always trying to share what I am learning, not my results. I work hard not to focus on results but the process which is why you never see me post anything about a win or loss but gaps in my thinking, if my thinking is spot on I will be profitable if not I have another opportunity to learn and share
Sep '24 •
Mastering Risk Management
If you want long term success, you've got to learn to manage risk. Anyone can get lucky with a big trade. But without risk management, you'll give most of your gains back sooner rather than later. Last night in our workshop, we talked about safe entries, how to approach profit taking, and where to place stop losses. If you missed it, no worries! We'll have the workshop again in a few weeks. For those of you who did make it, take a second and post your takeaways in the comments so that others can learn too! ✌️- Derek
1 like • Oct '24
@Derek Barnett It can definitely help you to front run the candles and see what is coming
Sep '24 •
Unlocking Your Financial Goals One Decision at a Time
Whether you're aiming for a modest supplement to your income or a significant life change, the market offers opportunities for all. Let's take inspiration from one of our members, Dan. Recently, he achieved a 10% return in just two weeks. Here's what Dan focuses on: - Consistency: He's dialed in on ONE setup that we teach in this free community. - Journaling: He's able to see exactly what he's excelling in and where he can improve. - Accountability: He's regularly being vulnerable and opening up so he can grow. Dan's approach has led to over a 75% win rate and a remarkable profit factor. If you're struggling, let me help you save some market tuition. Make sure you are taking advantage of ALL of the resources and opportunities we have in here to help you grow. Including: - Bonus content you can access through leveling up - Engagement in our community to grow together - Trash Panda Trading Games Rewards If you need help mapping out what a road to profitability could look like for you, click here to schedule a free roadmap to wealth session with Colby. Remember, every small step towards consistency can lead to significant outcomes. Your journey towards financial freedom starts with a single, committed action. Let's make it happen together. ✌️- Derek
2 likes • Sep '24
@Mikey Auskings I know I said "just do it" and it seems easier said than done, I get it, I still fail. Here is one form of accountability that works for me. I literally keep a printed out Excel spreadsheet on my desk that has my position size that I want to use for the week, for example this week it is "20 contracts" I am guilty at time of planning on 20 and then using 50. Having this spreadsheet here and my only goal is to check off that I used 20 at the end of the day is the kind of accountability that works for me. Everyone is different and you can find what works for you. Accountability to other people just flat out doesn't work for me, but that darn check mark on my piece of paper!!!
2 likes • Sep '24
@Mikey Auskings Honestly one of my favorite strategies to hold myself accountable is just to reduce position size for a period of time. If I have had a bad period of "trading behavior" or have slipped back into old habits I will cut it by half to regain momentum
1-8 of 8

Active 7d ago
Joined Sep 5, 2024
Powered by