Activity
Mon
Wed
Fri
Sun
Aug
Sep
Oct
Nov
Dec
Jan
Feb
Mar
Apr
May
Jun
What is this?
Less
More
Owned by Andrew
For traders struggling with consistency. Process-driven trading: transparent breakdowns, disciplined execution. No noise, no signals, no hype.
Memberships
Rick Orford's Trading Academy
954 members • Free
Options Made Simple Webinar
1.4k members • Free
Modern Wyckoff Trading Edu
32 members • Free
Millionaire Trading Academy
224 members • Free
Day Trading For Beginners
483 members • Free
Trading With Mustafa
2.8k members • Free
Millionaire Trading
6.7k members • Free
The Trading Residency
452 members • Free
INNER EDGE SCALPING
347 members • Free
2 contributions to Options Jive

May 19 •
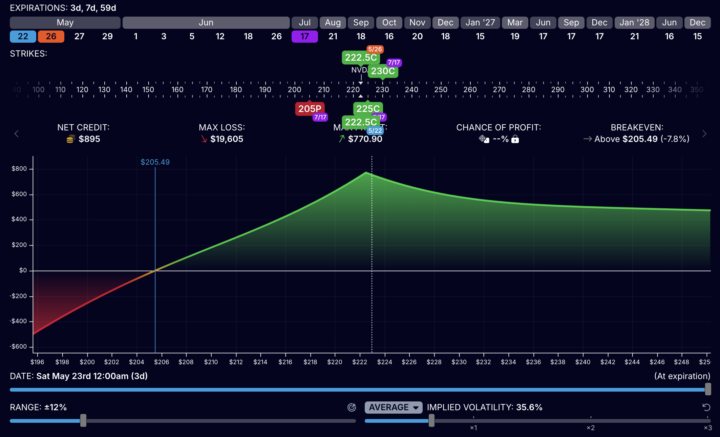
NVDA Volatility Targeting Masterpiece
NVDA prints tomorrow after the close. The options market is pricing roughly a 5-6% move, about $13 on a $222 stock. Now look at what Wall Street analysts say about just one line item. For the B-series chips alone, the new product line that drives the entire bull thesis, analyst estimates this quarter range from $9B to $67B. A $58B spread on one product. Data center revenue overall: $65B to $78B. Another $13B spread. The fundamental distribution is screaming wide, but the options market is paying you for a quiet move. Over the last 7 NVDA prints, the average post-earnings move was 4.0% versus an average implied of 6.7%. Realized over implied: 0.60. The event straddle has been systematically overpriced. 97% of sell-side analysts are bullish. The average price target sits 28% above spot. That is a crowded boat. Upside calls are expensive, and downside hedges feel ignored. The surface tells the same story. Front-week IV is loaded for the print. Back-month IV is calmer. Skew is flatter than usual because everyone is long upside. I can target all three distortions at once. That is the masterpiece. Layer 1: Call Calendar (front-week IV crush) Sell 222.5 call expiring 5/22 (3 DTE) at $7.55, Buy 222.5 call expiring 5/26 (7 DTE) at $8.10 Net debit: $0.43. Theta: +62. Buying Power used: $43. The 5/22 short collapses Thursday morning when IV gets crushed. The 5/26 long survives into the following week and holds value as long as NVDA pins near 222. This leg pays me if the body of the move is overpriced. Recent history says it is. Layer 2: Earnings Jade Lizard (longer-dated vol normalization, no upside risk) Sell 205 put expiring 7/17 (59 DTE) at $7.05, Sell 225 call at $15.30, Buy 230 call at $13.30 Total credit: $924 against a $5 wide call spread. Credit greater than width means no upside risk. If NVDA rips to $300, I still keep the call-side credit. POP: 74%, P50: 81%, BP: $7,475. This leg collects theta over 59 days while longer-dated IV normalizes after the print.

1 like • May 22
Excellent structuring. The 0.60 realised-to-implied ratio over the last 7 prints is interesting. Great example of trading the distribution shape rather than picking a direction.
May 11 •
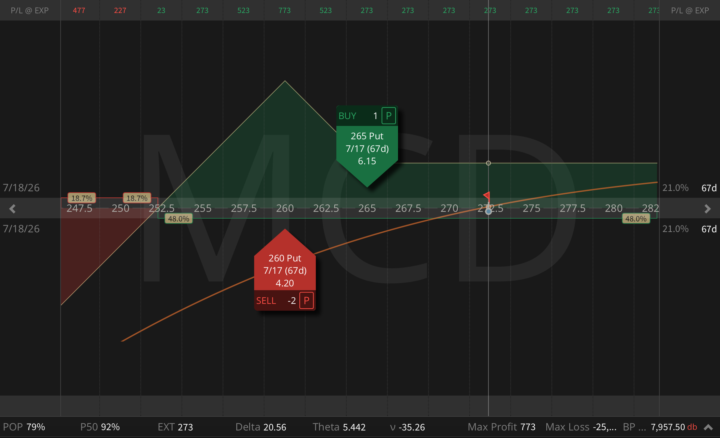
McDonald's Is Dropping After Earnings. Here's Why It's the Most Asymmetric Opportunity Right Now
We'll get back to tech trades next post. But today I want to talk about something more boring, and more interesting. McDonald's just dropped after earnings. It delivered strong results, offered cautious commentary on the consumer, and the stock has been drifting lower ever since. There was no gap down, just a slow, quiet grind. And this is exactly the kind of setup I look for. McDonald's Q1 2026 numbers came in clean across the board; it earned $2.83 adjusted EPS (against $2.74 expected), generated $6.52B in revenue (against $6.47B expected), global comparable sales grew 3.8%, with U.S. and international markets both up 3.9%. Management acknowledged pressure on the low-income consumer, but it had an answer. Value meals are holding traffic. The new Big Arch burger is pulling customers in. The business is not broken, but it simply told the truth about a difficult consumer environment, and in my view, the market punished it for the honesty. The Options Market Got It Wrong, Again Going into earnings, the options market was pricing in a 3.3-3.5% move. The actual move came in at -1.43%, followed by a slow drift lower over the next several sessions. This is a pattern. MCD's realized earnings moves have consistently landed around 1.7-2.2%, but the options market keeps pricing 3-3.5%. Here's what makes this particularly exciting to me: IV didn't collapse after earnings. The IV Rank is still sitting around 44. For a mega-cap defensive with low beta, high margins, and an asset-light franchise model that generates cash in every economic cycle, that's a gift. The market is still paying you a significant volatility premium. The VRP opportunity is still sitting right here. My Trade: Put Ratio Spread This is not a directional bet that McDonald's will bounce. My structure is designed to harvest that volatility premium, with a favorable worst-case outcome already baked into the payoff. My structure: - Buy 1x 265 Put (July 17) @ $6.15, Sell 2x 260 Put (July 17) @ $4.20 - Max profit: $773, Net credit: $273, Probability of Profit: 80%, P50: 92%, Theta: $5.44/day
1 like • May 15
This kind of analysis I rarely see in communities. I appreciate the worst-case framing — structuring it so even an assignment becomes an attractive income position. The VRP angle with IV rank still at 44 post-earnings is sharp. Curious — how do you decide between the butterfly conversion and the strangle conversion if it moves against you? Is that a delta threshold or a price level trigger?"
1-2 of 2
@andrew-cahill-3270
Engineering leader → Systematic trader | 8yrs in markets | Free daily briefings + real-time trades inside → Verstrata
Active 52m ago
Joined Apr 24, 2026