Activity
Mon
Wed
Fri
Sun
Feb
Mar
Apr
May
Jun
Jul
Aug
Sep
Oct
Nov
Dec
Jan
What is this?
Less
More
Memberships
AI Blueprint
64 members • $10/m
Elite Academy
557 members • Free
Trader Foundation
1.2k members • $50/m
InvestCEO with Kyle Henris
40k members • Free
Trading Growth Engine
763 members • Free
Platinum Coaching
127 members • Free
Gextron
12 members • Free
14 contributions to Trading Growth Engine

Jan '25 •
Make sure to have this indicator on
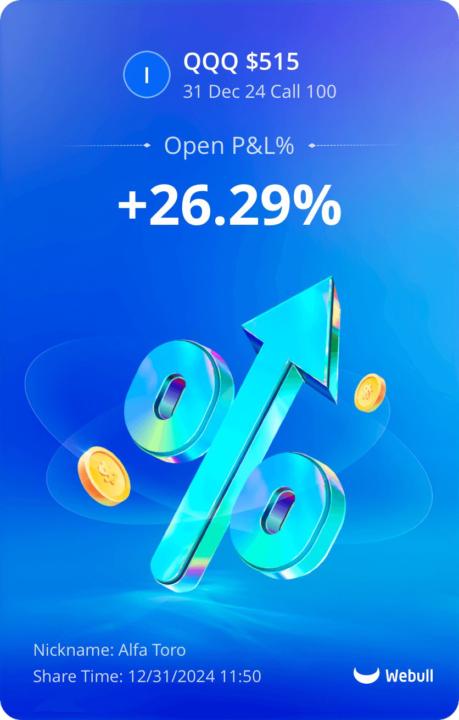
Friends, Happy New Year! Yesterday, I alerted inside TGE Max to go long on QQQ. Through out this trade, I explained the thought process every minute of the trade. How I'm analyzing price. How I'm thinking about stops, entries, and exits. How to analyze volume. How to adapt and get out if price action is seeming weak. One of the best indicators to help you is the volume indicator. Understanding volume: - Can identify price move strength - Can signal caution of buyer/seller exhaustion - Can reveal footprints of large orders (paired with Gextron is awesome) Allows us to stay ahead of the game, and capitalize on great setups. I highly recommend you learn to use the first month of this new year. By a raise of hand, and be honest, how many of you use it? 1️⃣ I use it every day! 2️⃣ It's on but I don't use it 3️⃣ It's not even on my charts

4 likes • Jan '25
1️⃣ - volume is key! It shows where “big money” is going, and that’s who we need to follow
Nov '24 •
Black Friday Sale
Hey friends, just wanted to announce that Gextron will be $300 OFF from original price. This sale will only be available until 6PM EST today! Click here to get access: https://www.skool.com/tge
1 like • Nov '24
When would we see the discount?

1 like • Nov '24
Where is that screenshot from? That’s a near earnings summary infographic
1 like • Nov '24
@Manj Dona typo - I meant a “NEAT” earnings summary infographic. I just like the look of it and would go to that source if I knew where it was from

1 like • Nov '24
Wish I could hop on but you know I’ll be reviewing that recording

Nov '24 •
Holiday Season Brings Promising Market Trends
As we step into the holiday season, the stock market often aligns with historically favorable trends. The S&P 500 (SPX) has pulled back slightly from its record high of 6,020 but continues to find strong support around 5,870. This level, which coincides with October’s highs, is crucial for the market's direction in the short term. Current Market Overview 1. S&P 500 Key Levels: Support at 5,870 remains intact, marked by the last four trading sessions’ daily lows. A decisive close below this level for two consecutive days could shift the market outlook to neutral or bearish, with the next support at 5,670. 2. Rare Chart Patterns: The SPX chart reveals two rare "island reversal" patterns. A bullish island reversal features a gap down followed by a gap up, while a bearish island reversal is the opposite. These patterns signal potential market turning points, depending on whether SPX fills gaps at 5,942 (bullish) or 5,783 (bearish). 3. Volatility and Risk: The VIX has risen moderately but remains below levels that would indicate heightened market risk. Its position above the 200-day moving average, however, suggests caution, as it could hint at building bearish momentum. Seasonal Trading Opportunities The holiday season is traditionally marked by three bullish trends: - Post-Thanksgiving Rally: A historically strong market period lasting two weeks after Thanksgiving. - January Effect: Once a January phenomenon, small-cap rallies now typically occur in December due to early buying by traders. - Santa Claus Rally: A bullish stretch encompassing the last five trading days of the year and the first two trading days of the next. Traders can capitalize on these trends with targeted strategies. For example, using options on the iShares Russell 2000 ETF (IWM) allows for a structured approach to benefit from anticipated small-cap strength. Market Signals to Watch - Market Breadth: Oscillators continue to lean bearish, but new highs outpacing new lows on the NYSE keep the broader market sentiment positive for now. - Put-Call Ratios: These indicators remain neutral, awaiting clearer signals to confirm the next market direction.
1 like • Nov '24
@Phil Vo - would love to better understand the concept of the island reversal. If I’m reading and interpreting your comments correctly, you are talking about SPX on the daily chart and the fact we were trading between the gap up on Nov 5 / H:5783 and the gap down on Nov 14 / L: 5942? But we’ve also closed that gap down, correct? So for now, short term sentiment would stay with bulls from where last week closed?
1-10 of 14

@aaron-rugg-4111
Husband, father of twin boys, college football fan, lover of BBQ, music, cooking and craft beer. Seattle / Pacific Northwest is home!
Active 44d ago
Joined Nov 14, 2024
Seattle, WA
Powered by