Activity
Mon
Wed
Fri
Sun
Feb
Mar
Apr
May
Jun
Jul
Aug
Sep
Oct
Nov
Dec
Jan
What is this?
Less
More
Memberships
Roadman Cycling Collective +
107 members • $15/month
22 contributions to Roadman Cycling Collective +

⭐
1d •
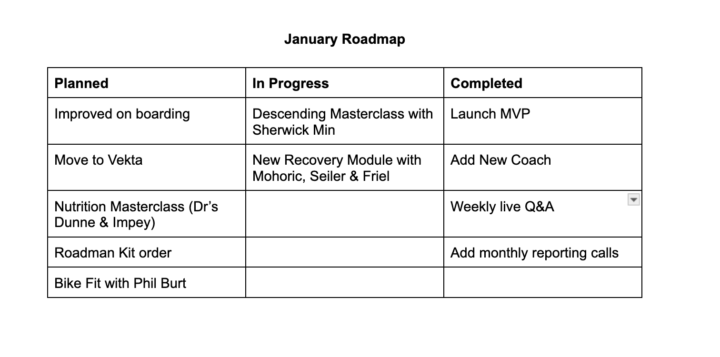
Our January Roadmap
Wanted to share the January Development Roadmap for the community so you can all know what to expect. It's been an amazing start to the year and we've some really cool projects in the works to bring you. The ambitious aim is to get all this delivered by the end of the month.
3 likes • 22h
Exciting plan! Glad to be a part of it.
3 likes • 3d
First time trying Tabatas intervals. I sucked.
⭐
4d •
Do you service your own bike?
Curious to see who works on their own bike and who would be eager to learn?
Poll
47 members have voted

3 likes • 4d
@Matthew Devins I used to do everything on my bike from installing headset, BB on a bare frame, building wheels, etc. But that was before everything changed to electronic. I just hand it over to the shop now and only lube my chain :)
5d •
Nasal Strips
Question to @Matthew Devins and @Anthony Walsh: have there been any studies done and what is the general consensus on the performance advantages of using Breathe Right nasal strips in training or racing?

7d •
Admin Tip : Headunit Data Screens
We were talking about lap screens last night and this gave me an idea to share what data I have on my wahoo screen. I have a few different pages: Default page which I use for my normal riding Map screen which I use for following routes Lap screen which I use for intervals Climbing screen which I use to see any relevant climbing stats. Maximums screen where I can some cool numbers. I will breakdown exactly what I have and the reasons why I have some more niche ones. Most of them are obvious enough. But let me know if you have any questions! My general default page (in order): Average power 5sec Active time (workout) - my total ride time Heart rate Current speed Distance Cadence Average power Calories Intensity Factor TSS I always have it zoomed in so I am only seeing as far down as average power. I can zoom out and view the final three fields if I like - normally it’s more interesting on a longer/harder day out to get a sense of how hard it’s been in numbers. My 5 second power has its own row at the top so that stands out the most at any given time - this is my most important field so I keep it on top. My map screen : For training I use 5 second power and active time (workout) and sometimes I add heart rate. This is so I can keep an eye on how hard I am riding and keeping an eye on the time so I’m not forgetting about fuelling. The rest of the screen is the map so I can see where I’m going and follow the route. For racing I change it up. I remove power and heart rate and instead use distance and time. Time is there to stay on top of fuelling and distance is there so I can see how far to go until key sections. I will have notes on the stem about cross wind sections, potentially dangerous climbs, narrow sections where positioning needs to be dialled etc. power and heart rate are no good on race day as it only holds you back. It restricts race instinct which was one of my biggest strengths. It’s different if you’re doing massive climbs and need to keep an eye on pacing but that’s not relevant to me.
1 like • 7d
Thanks @Matthew Devins for this! It's great to see what the pros have on their dashboards - what gets measured, gets managed :)
1-10 of 22
Active 1h ago
Joined Dec 18, 2025
Powered by